
Bridge User Manual

Chapter 11 Loops and Charts
© National Instruments Corporation 11-13 BridgeVIEW User Manual
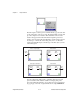
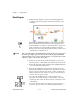
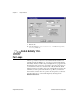
For example, if a shift register contains three elements in the left terminal,
you can access values from the last three iterations, as shown in the
following illustration.
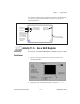
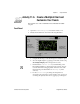
Activity 11-5. Use a Shift Register
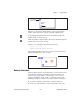
Your objective is to build a VI that displays a running average on a chart.
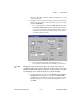
Front Panel
1. Open a new front panel and create the objects as shown in the
following illustration.
2. Change the scale of the Waveform chart to range from
0.0
to
2.0
.
Contains i–1
Contains i–2
Contains i–3
Previous values
are available at
the left terminal.
Latest value
passes to the
right terminal.
Pop up on left
terminal to add
new elements or
use Positioning
tool to resize the
left terminal to
expose more
elements.
Pop up on border
for new shift register.