
Bridge User Manual


Chapter 14 Arrays, Clusters, and Graphs
© National Instruments Corporation 14-21 BridgeVIEW User Manual
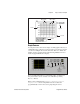
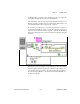
The Temperature waveform chart displays the temperature as it is
acquired. After acquisition, the VI plots the data in
Temp Graph
. The
Mean
,
Max
, and
Min
digital indicators display the average, maximum,
and minimum temperatures.
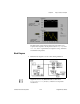
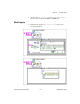
Block Diagram
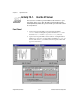
2. Build the block diagram as shown in the following illustration:
Digital Thermometer VI (Functions»Select a VI from the
BridgeVIEW\Activity
directory)—Returns one temperature
measurement.