
Bridge User Manual


Chapter 14 Arrays, Clusters, and Graphs
© National Instruments Corporation 14-23 BridgeVIEW User Manual
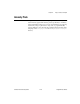
Intensity Plots
BridgeVIEW has two methods for displaying 3D data: the intensity chart
and the intensity graph. Both intensity plots accept 2D arrays of numbers,
where each number is mapped to a color. You can define the color mapping
interactively, using an optional color ramp scale, or programmatically,
using an attribute node for the chart. For examples using the intensity chart
and graph, refer to
intgraph.llb
in the
Examples\General\Graphs
directory.