
Instructions/Assembly Guide


30
a.) TIME (total), DISTANCE (total), and CALORIES (total)
b.) SPEED (average), RPM (average), and HEART RATE (average)
c.) TIME (average), LE9EL (average), and CALORIES (average).
Push the Left(e) or Right(f) buttons to move through the result channels manually.
During the Cool Down period, the Resistance Level will adjust to a third of the average Level of the workout. The Cool
Down resistance level can be adjusted with the Resistance Increase and Decrease buttons, but the Console will not dis
play the value.
You can push PAUSE/END to stop the Results / Cool Down period and go back to PowerUp Mode. If there is no RPM or
HR signal, the Console automatically goes into Sleep Mode.
GOAL TRACK Statistics (and Achievements)
The statistics from every workout are recorded to a User Pro¿le.
The Nautilus Dual Track™ Console shows the Goal Track workout Statistics on the Lower Display in three channels
a.) TIME (total), DISTANCE (total), and CALORIES (total)
b.) SPEED (average), RPM (average), and HEART RATE (average)
c.) TIME (average), DISTANCE (average) / or LE9EL (average) *, and CALORIES (average)
* If the Goal Track Statistic is a single workout, LE9EL (average) is displayed. If the Goal Track Statistic is a
combination of multiple workouts, DISTANCE (average) is displayed instead of LE9EL (average).
To view the GOAL TRACK statistics of a User Pro¿le
1. From the PowerUp screen, push the User button to select the correct User pro¿le.
2. Push the GOAL TRACK button. The Console will display the LAST WORKOUT values and activate the corresponding
Achievement light.
Note: Goal Track statistics can be viewed even during a workout. Push GOAL TRACK and the LAST WORKOUT values
will be displayed. The workout values for the current workout will be hidden e[cept for the GOAL display. Push
GOAL TRACK again to return to the PowerUp screen.
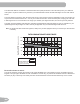
3. Push the Increase(c) button to move to the ne[t GOAL TRACK statistic, “LAST 7 DAYS”. The Console will display
the calories burned on the display (50 calories per segment) for the previous seven days, along with the workout value
totals. Use the Left(e) or Right(f) buttons to move through all the workout statistic channels.
4. Push the Increase(c) button to move to “LAST 30 DAYS”. The Console will display the total values for the previous
thirty days. Use the Left(e) or Right(f) buttons to move through all the workout statistic channels.
5. Push the Increase(c) button to move to the “LONGEST WORKOUT”. The Console will display the workout values with
the most Time value. Use the Left(e) or Right(f) buttons to move through all the workout statistic channels.
. Push the Increase(c) button to move to the “CALORIE RECORD”. The Console will display the workout values with the
most Calories value. Use the Left(e) or Right(f) buttons to move through all the workout statistic channels.
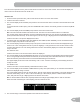
7. Push the Increase(c) button to move to “BMI”, or Body Mass Inde[. The Console will display the BMI value based on
the User settings. Be sure the height value is correct for your User Pro¿le, and the weight value is current.
The BMI Measurement is a useful tool that shows the relationship between weight and height that is associated with body
fat and health risk. The table below gives a general rating for the BMI score
Underweight Below 18.5
Normal 18.5 ± 24.9
Overweight 25.0 ± 29.9
Obesity 30.0 and above
Note: The rating may overestimate body fat in athletes and others who have a muscular build. It may also underesti
mate body fat in older persons and others who have lost muscle mass.