
User's Manual


Page 11 of 12
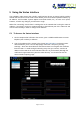
Within the basic view (when not logged in to the sensor), Vertex provides four main pages,
accessible from the four buttons in the top left corner:
Status - Displays basic static settings (i.e. auto-hostname, serial number, IP address, etc.)
plus dynamic graphs (arranged on two tabs in the lower portion of the page) that provide
Temperature and Rotation details. Each graph shows the following about each parameter:
• Actual Value (Blue): Instantaneous value.
• Expected Value (Green): Expected value based on the configuration of the radar.
• Min / Max Values (Red): The min & max allowed values for each metric.
System Information - Provides three pages of detailed settings under the sub headings of
System, Radar and Advanced. Click the System Information option to reveal the three sub-
headings.
Log Viewer - A full list of all sensor activities. Viewing is possible while not logged-in,
however, you must log in if you wish to download the record.
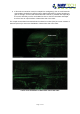
Radar Data - Allows you to view the live radar data. Two other buttons are shown in green
at the top right corner of the page: Report - Click on this option to display a configuration
summary report that details all of the key sensor settings.
Login - Click on this option to login so that changes can be made to the service date.