N8406-022A 1Gb Intelligent L2 Switch Browser-based Interface Reference Guide Part number: 856-126757-406-00 First edition: July 2008 456-01758-000 PN# 456-01766-000
Legal notices © 2008 NEC Corporation The information contained herein is subject to change without notice. The only warranties for NEC products and services are set forth in the express warranty statements accompanying such products and services. Nothing herein should be construed as constituting an additional warranty. NEC shall not be liable for technical or editorial errors or omissions contained herein. Microsoft®, Windows®, and Windows NT® are U.S. registered trademarks of Microsoft Corporation.
Contents Getting started Introduction ............................................................................................................................................................. 6 Additional references .............................................................................................................................................. 6 Features ..........................................................................................................................................
Interface (“if”) Statistics - Input ........................................................................................................................ 53 Interface (“if”) Statistics - Output ..................................................................................................................... 54 Ethernet (“dot3”) Statistics .............................................................................................................................. 54 GEA IP Statistics .................
Default Gateways Configuration ......................................................................................................................... 114 Default Gateway Configuration........................................................................................................................... 115 IGMP Snooping Configuration ............................................................................................................................ 116 IGMP Filters Configuration ..............
Getting started Introduction The 1Gb Intelligent L2 Switch software lets you use your Web browser to access switch information and statistics and perform switch configuration via the Internet. This guide provides an overview of how to access and use the switch browser-based interface (BBI) on the Layer2 switch mode. For the information of how to use the SmartPanel mode, see the SmartPanel Reference Guide.
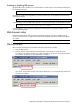
Enabling or disabling BBI access By default, BBI access is enabled. If you need to disable or re-enable access, use the following command from the command line interface: >> Main# /cfg/sys/access/http By default, secure BBI access is disabled. If you need to enable access, use the following command from the command line interface: >> Main# /cfg/sys/access/https/access The default TCP port to use for BBI access is port 80.
If the switch IP interface address has a name on your local domain name server, you can enter the name instead. Using Internet Explorer, you can enter the following: 3. Log in to the switch. If your switch and browser are properly configured, you will be asked to enter a password. Enter the account name and password for the switch. For more password information, see the Command Reference Guide.
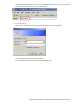
4. Allow the BBI Dashboard page to load. When the proper account name and password combination is entered, the BBI Dashboard page is displayed in the browser viewing area. NOTE: There may be a slight delay while the Dashboard page is initializing. You should not stop the browser while loading is in progress. When loading is complete, a folder icon for the switch displays in the left-hand BBI window. Click this folder and a tree of folders displays.
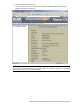
Browser-based interface basics Introduction Once you are properly logged in, the switch BBI displays in the Web browser-viewing window. Toolbar Forms Window Navigation Window There are three main regions on the screen. The Toolbar is used for selecting the context for your actions in the other windows. The Navigation window is used for selecting particular items or features to act upon. The Forms window is used for viewing or altering switch information.
Commands The following general commands are available on the toolbar: Table 2 Toolbar commands Command Description Apply Pending configuration changes do not take effect until you select the Apply command. Once applied, all changes (except enabling/disabling Spanning Tree Protocol) take effect on the switch immediately. If you do not save the changes, however, they will be lost the next time the switch is rebooted.
Forms window When a feature icon is selected on the navigation window, a status, statistics, or configuration form is displayed in the forms window. The exact nature of the form depends on the current context selected on the toolbar, as well as the type of information available. Not all feature icons have forms for all contexts. Some forms display switch information such as settings, status, or statistics. Others allow you to make configuration changes to switch parameters.
Dashboard Introduction The switch BBI can be used to view the present settings and operating status of a variety of switch features. Most of the same information available through the switch‟s command line interface is present on the dashboard forms. The following provides a basic outline for viewing the dashboard forms. You should first be familiar with configuration as covered in the Command Reference Guide. Steps for displaying dashboards Follow these basic steps for viewing switch dashboard forms. 1.
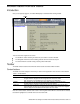
3. View information shown in the forms window. NOTE: Items that load other forms when selected are underlined. 4. Select an underlined item to view details or perform actions.
In this example, click a Spanning Tree Group number to view detailed information about the group (shown in form below).
Switch Dashboard To display the following form, select System > General. This is the default form for the switch. The following table describes the Switch Dashboard controls: Table 3 Switch Dashboard controls Control Description Switch Name Displays the name of the switch, as entered in Configuration > Switch > General (SNMP). Displays the location of the switch, as entered in Configuration > Switch > General (SNMP). Displays the type of switch.
User Access Dashboard To display the following form, select System > User Table. The following table describes the User Access Dashboard controls: Table 4 User Access Dashboard controls Control Description User ID User Name COS Password Status Login Displays the numeric identifier for the user Displays the name of the user. Displays the Class of Service level for the user. Indicates whether a valid password is defined for the user. Displays whether the user is enabled or disabled.
Switch Image and Configuration Management Dashboard To display the following form, select System > Config/Image Control. The following table describes the Switch Image and Configuration Dashboard controls: Table 5 Switch Image and Configuration Dashboard controls Control Description Active Image Version Next Boot Image Selection Displays the number of the active software image. Displays which software image (image1 or image2) will be loaded into switch memory for the next reboot.
Management Network Definition Dashboard To display the following form, select System > Mgmt. The following table describes the Management Network Definition Dashboard controls: Table 6 Management Network Definition Dashboard controls Control Description Entry Management Network Management Network Subnet Mask Displays the entry number for each management network. Displays the IP address of the management network. Displays the subnet mask of the management network.
Switch Ports Dashboard To display the following form, select Switch Ports (click the underlined text, not the folder). The following table describes the Switch Ports Dashboard controls: Table 7 Switch Ports Dashboard controls Control Description Status Switch Port Info Shows if the port is enabled (green) or disabled (black). Summarizes the following port information: STP: Shows if the port has Spanning Tree Protocol enabled or disabled. rmon: Shows if RMON is enabled or disabled.
Forwarding Database Information To display the following form, select Layer 2 > FDB. The forwarding database (FDB) contains information that maps the media access control (MAC) address of each known device to the switch port where the device address was learned. The FDB also shows which other ports have seen frames destined for a particular MAC address. NOTE: The master forwarding database supports up to 8K MAC address entries on the MP per switch.
VLANs Dashboard To display the following form, select Layer 2 > Virtual LANs (click the underlined text, not the folder). This form displays information for all configured VLANs and all member ports that have an active link state. The following table describes the VLANs Dashboard controls: Table 9 VLANs Dashboard controls Control Description Search Range Search Options To search for a VLAN, enter a range of VLAN numbers in the From and To fields.
Switch Spanning Tree Groups Information To display the following form, select Layer 2 > Spanning Tree Groups (click the underlined text, not the folder). The following table describes the Switch Spanning Tree Groups Information controls: Table 10 Switch Spanning Tree Groups Information controls Control Description Search Range To search for a Spanning Tree Group, enter a range of group numbers in the From and To fields.
Table 10 Switch Spanning Tree Groups Information controls Control Description Bridge Forward Delay Specifies, in seconds, the amount of time that a bridge port has to wait before it changes from learning state to forwarding state. This command does not apply to MSTP. Specifies, in seconds, the amount of time the bridge waits without receiving a packet from a station before removing the station from the Forwarding Database.
The following table describes the Switch Spanning Tree Group Information controls: Table 11 Switch Spanning Tree Group Information controls Control Description Spanning Tree State Shows if Spanning Tree is turned on or off for the switch. VLANs Current Root Displays the VLANs that are members of this Spanning Tree Group. Displays information about the root bridge for the Spanning Tree. Information includes the priority (hex) and MAC address of the root.
Switch Trunk Groups Dashboard To display the following form, select Layer 2 > Trunk Groups. When trunk groups are configured, you can view the state of each port in the various trunk groups. NOTE: If Spanning Tree Protocol on any port in the trunk group is set to forwarding, the remaining ports in the trunk group will also be set to forwarding.
Trunk Hash Dashboard To display the following form, select Layer 2 > Trunk Hash. The following table describes the Layer 2 (L2) Trunk Hash Dashboard controls: Table 14 Trunk Hash Dashboard controls Control Description Smac Hash Displays the status of the source MAC hash: enabled or disabled. Dmac Hash Displays the status of the destination MAC hash: enabled or disabled. Sip Hash Displays the status of the source IP hash: enabled or disabled.
The following table describes the Switch LACP Dashboard controls: Table 15 LACP Dashboard controls Control Description Switch Port Displays the port number. LACP Mode Displays the port‟s LACP mode (active, passive, or off). LACP Adminkey Displays the value of the port‟s adminkey. LACP Operkey Displays the value of the port‟s operkey. LACP Selected Indicates whether the port has been selected to be part of a Link Aggregation Group. Port Priority Shows the value of the port priority.
Uplink Fast General Information To display the following form, select Layer 2 > Uplink Fast. The following table describes the Uplink Fast Information controls: Table 16 Uplink Fast General Information controls Control Description STP Uplink Fast Mode STP Uplink Fast Rate Displays the status of STP Uplink Fast: ON or OFF. Displays the value of the Uplink Fast station update rate, in seconds.
RMON History Group Information To display the following form, select RMON > History (click the underlined text, not the folder). This form displays information for all configured RMON History Groups. The following table describes the RMON History Group Dashboard controls: Table 17 RMON History Group Dashboard controls Control Description Search Range Search Options To search for a History Group, enter a range of numbers in the From and To fields.
RMON Alarm Group Information To display the following form, select RMON > Alarm (click the underlined text, not the folder). This form displays information for all configured RMON Alarm Groups. The following table describes the RMON Alarm Group Dashboard controls: Table 18 RMON Alarm Group Dashboard controls Control Description Search Range Search Options To search for a RMON Alarm Group, enter a range of numbers in the From and To fields.
Table 18 RMON Alarm Group Dashboard controls Control Description Sample Type Displays the method of sampling the selected variable and calculating the value to be compared against the thresholds, as follows: abs: absolute value, the value of the selected variable is compared directly with the thresholds at the end of the sampling interval. delta: delta value, the value of the selected variable at the last sample is subtracted from the current value, and the difference compared with the thresholds.
IP Interfaces Dashboard To display the following form, select Layer 3 > IP Interfaces (click the underlined text, not the folder). The following table describes the IP Interfaces Dashboard controls: Table 20 IP Interfaces Dashboard controls Control Description Search Range To search for an IP Interface, enter a range of IP Interface numbers in the From and To fields.
ARP Cache Information To display the following form, select Layer 3 > ARP (click the underlined text, not the folder). The ARP information includes IP address and MAC address of each entry, address status flags, VLAN, and port for the address, and port referencing information.
Default Gateways Dashboard To display the following form, select Layer 3 > Default Gateways (click the underlined text, not the folder). The following table describes the Default Gateways Dashboard controls: Table 23 Default Gateways Dashboard controls Control Description Search Range To search for a Default Gateway, enter a range of Gateway numbers in the From and To fields.
IGMP Snooping Dashboard To display the following form, select Layer 3 > IGMP > IGMP Snooping (click the underlined text, not the folder). IGMP Multicast Groups The following table describes the IGMP Multicast Groups information. Table 24 IGMP Multicast Groups information Field Description Group VLAN Version Ports Expires Displays the IP address of the IGMP Multicast Group. Displays the VLAN number of the IGMP Multicast Group. Displays the IGMP version.
IGMP Static Multicast Router Configuration To display the following form, select Layer 3 > IGMP > IGMP Static Mrouter (click the underlined text, not the folder). The following table describes the IGMP Static multicast router (Mrouter) information. Table 26 IGMP Static Multicast Router information Field Description Mrouter Port Vlan Version Displays the port where the static Mrouter is configured. Displays the VLAN number of the IGMP Multicast Group. Displays the IGMP version.
Uplink Failure Detection Dashboard To display the following form, select Uplink Failure Detection (click the underlined text, not the folder). The following table describes the Uplink Failure Detection Dashboard controls: Table 27 Uplink Failure Detection Dashboard controls Control Description UFD State FDP FDP State LtM status LtD status LtM Ports LtD Ports Displays the global status of Uplink Failure Detection. Displays the number of the Failure Detection Pair.
Viewing statistics Introduction The switch BBI can be used to view a variety of switch performance statistics. The same statistics that are available through the switch‟s command line interface are present on the BBI statistics forms. The following provides a basic outline for viewing statistics. You should first be familiar with configuration as covered in the Command Reference Guide. Steps for displaying statistics Follow these basic steps for viewing switch statistics. 1.
3. View the statistics in the forms window. For example: NOTE: Items that load other forms when selected are underlined. 4. Select an underlined item to view details on a per port basis. For example: NOTE: This page is refreshed every 5 seconds.
Management Processor Statistics To display the following form, select System > General. This form displays a summary of management processor (MP) statistics. MP statistics are described in the following table: Table 28 Management Processor Statistics Statistic Syntax and Usage IF Stats IP Stats ICMP Stats UDP Stats TCP Stats SNMP Stats CPU Utilization FDB Stats Click IF Stats to display IF portion of TCP/IP statistics Click IP Stats to display IP portion of TCP/IP statistics.
TCP/IP Statistics (IF and IP Statistics) To display the following form, go to the Management Processor Statistics form. Select one of the following: IF Stats, IP Stats, ICMP Stats, or TCP Stats. The following table describes the interface statistics: Table 29 IF statistics Statistics Description ifInOctets ifInUcastPkts The total number of octets received on the interface, including framing characters.
Table 29 IF statistics Statistics Description ifOutErrors For packet-oriented interfaces, the number of outbound packets that could not be transmitted because of errors. For character-oriented or fixed-length interfaces, the number of outbound transmission units that could not be transmitted because of errors. The number of outbound packets, which were chosen to be discarded even though no errors had been detected to prevent their being transmitted.
TCP/IP Statistics (ICMP and TCP Statistics) To display the following form, go to the Management Processor Statistics form. Select one of the following: IF Stats, IP Stats, ICMP Stats, or TCP Stats.
ICMP statistics are described in the following table: Table 31 ICMP Statistics Statistic Description icmpInMsgs The total number of ICMP messages which the entity (the switch) received. Note that this counter includes all those counted by icmpInErrors. The total number of ICMP messages which this entity (the switch) attempted to send. Note that this counter includes all those counted by icmpOutErrors.
TCP statistics are described in the following table: Table 32 TCP Statistics Statistic Description tcpInSegs The total number of segments received, including those received in error. This count includes segments received on currently established connections. The total number of segments sent, including those on current connections, but excluding those containing only retransmitted octets. The algorithm used to determine the timeout value used for retransmitting unacknowledged octets.
UDP/SNMP Statistics To display the following form, go to the Management Processor Statistics form. Select UDP Stats or SNMP Stats. UDP statistics are described in the following table: Table 33 UDP Statistics Statistic Description udpInDatagrams udpOutDatagrams udpInErrors The total number of UDP datagrams delivered to the switch. The total number of UDP datagrams sent from this entity (the switch).
SNMP statistics are described in the following table: Table 34 SNMP Statistics Statistic Description snmpInPkts The total number of Messages delivered to the SNMP entity from the transport service. The total number of SNMP Messages that were passed from the SNMP protocol entity to the transport service. The total number of SNMP Protocol Data Units (PDUs) that were delivered to the SNMP protocol entity and for which the value of the error-status field is too big.
Table 34 SNMP Statistics Statistic Description snmpInBadCtyUses The total number of SNMP Messages delivered to the SNMP protocol entity that represented an SNMP operation that was not allowed by the SNMP community named in the Message. An object to enable or disable the authentication traps generated by this entity (the switch). The total number of ASN.1 or BER errors encountered by the SNMP protocol entity when decoding SNMP Messages received.
FDB Statistics To display the following form, go to the Management Processor Statistics form. Select FDB Stats. FDB statistics are described in the following table: Table 36 Forwarding Database Statistics Statistic Description current hiwat Current number of entries in the Forwarding Database. Highest number of entries recorded at any given time in the Forwarding Database. Network Time Protocol Statistics To display the following form, select System > NTP.
Network Time Protocol statistics for the primary and secondary NTP servers are described in the following table: Table 37 NTP Statistics Statistic Description Request Sent The total number of NTP requests the switch sent to the primary NTP server to synchronize time. The total number of NTP responses received from the primary NTP server. The total number of times the switch updated its time based on the NTP responses received from the primary NTP server.
Port Statistics To display the following form, go to the Switch Ports Statistics Summary form. Select a Switch Port number.
Port statistics are described in the following table: Table 38 Port Statistics Control Description Clear Port x Statistics Operational Status RMON Operational Status Select Clear and click Submit to clear statistics for this port. Enables or disables the port. Enables or disables RMON for the port. The next several tables contain specific information about bridging, interface (input and output), and Ethernet statistics.
Interface (“if”) Statistics - Output The following table describes the interface output statistics of the selected port: Table 41 Interface Statistics for a Port - Output Statistic Description HC Octets HC UCastPkts The total number of octets transmitted out of the interface, including framing characters.
Table 42 Ethernet Statistics for a Port Statistic Description Excess Collisions A count of frames for which transmission on a particular interface fails due to excessive collisions. A count of frames for which transmission on a particular interface fails due to an internal MAC sub layer transmit error.
FDB Statistics To display the following form, select Layer 2 > FDB. FDB statistics are described in the following table: Table 44 Forwarding Database Statistics Statistic Description Clear FDB Statistics Select Clear and click Submit to clear FDB statistics. current hiwat Current number of entries in the Forwarding Database. Highest number of entries recorded at any given time in the Forwarding Database.
LACP Statistics To display the following form, select Layer 2 > LACP. Enter a port number to show LACP Statistics for the port. The following table describes LACP statistics: Table 45 LACP Statistics Statistic Description Port Displays the port number. Show Enter a port number and select Show to display LACP statistics for the port. Valid LACPDUs received Total number of LACP data units received. Valid Marker PDUs received Not applicable (see note).
IP Statistics To display the following form, select Layer 3 > IP Interfaces (click the underlined text, not the folder). The following table describes IP statistics: Table 46 IP Statistics Statistic Description ipInReceives The total number of input datagrams received from interfaces, including those received in error. The number of input datagrams discarded because the IP address in their IP header‟s destination field was not a valid address to be received at this entity (the switch).
ARP Statistics To display the following form, select Layer 3 > ARP (click the underlined text, not the folder). The following table describes Address Resolution Protocol (ARP) statistics: Table 47 ARP Statistics Statistic Description arpEntriesCur arpEntriesHighWater The total number of outstanding ARP entries in the ARP table. The highest number of ARP entries ever recorded in the ARP table.
VLAN - IGMP Snooping Statistics To display the following form, go to the IGMP VLAN Snooping Statistics Summary form. Select a VLAN number.
Domain Name System Statistics To display the following form, select Layer 3 > Domain Name System. The following table describes DNS statistics: Table 50 DNS Statistics Statistic Description DNS In Requests The total number of DNS request packets that have been received. The total number of DNS request packets received that were dropped. The total number of DNS response packets that have been transmitted.
IP Routing Management Statistics (part one) To display the following form, select Layer 3 > General or Layer3 > General. The following table describes IP Routing Management statistic controls: Table 51 IP Interface Management Statistics Controls Statistic Description Clear IP statistics IP Interface Number (1-256) IP Interface Statistics Clears all IP statistics. Selects an interface to display statistics. Select Clear and click Submit to clear statistics for the selected interface.
The following table describes IP Routing Management statistics for the selected interface: Table 52 IP Routing Management Statistics Statistic General InReceives InDelivers FwdDatagrams FragOKs Frag Creates InDiscards IP Interface Statistics ifInOctets ifInNuCastPkts ifInErrors ifOutOctets ifOutNucastPkts ifOutErrors ifInUcastPkts ifInDiscards ifInUnknownProtos ifOutUcastPkts ifOutDiscards ifStateChanges Description The total number of input datagrams received from interfaces, including those rece
IP Routing Management Statistics (part two) To display the following form, select Layer 3 > General or Layer3 > General. The following table describes Address Resolution Protocol statistics Table 53 ARP Statistics Statistic Description Current Entries High Water Mark Maximum Entries The total number of outstanding ARP entries in the ARP table. The highest number of ARP entries ever recorded in the ARP table. The maximum number of entries allowed in the ARP table.
ICMP statistics are described in the following table: Table 54 ICMP Statistics Statistic Description icmpInMsgs The total number of ICMP messages which the entity (the switch) received. Note that this counter includes all those counted by icmpInErrors. The total number of ICMP messages which this entity (the switch) attempted to send. Note that this counter includes all those counted by icmpOutErrors.
TCP statistics are described in the following table: Table 55 TCP Statistics Statistic Description tcpInSegs The total number of segments received, including those received in error. This count includes segments received on currently established connections. The total number of segments sent, including those on current connections, but excluding those containing only retransmitted octets. The algorithm used to determine the timeout value used for retransmitting unacknowledged octets.
Uplink Failure Detection Statistics To display the following form, select Uplink Failure Detection (click the underlined text, not the folder). The following table describes commands for Uplink Failure Detection (UFD) statistics: Table 57 Uplink Failure Detection Statistics Control Description Clear UFD Statistics FDP Number of times LtM link failure To clear UFD statistics, select clear in the drop-down list, and click Submit. The number of the Failure Detection Pair.
Configuring the switch Introduction The switch BBI can be used to view and change switch configuration parameters. The same configuration parameters that are available through the switch‟s command-line interface are present on the BBI configuration forms. The following provides a basic outline for switch configuration. You should first be familiar with configuration as covered in the Command Reference Guide.
3. View or make changes to the settings shown in the forms window. For example: NOTE: Some fields are highlighted on the forms in green type─they must be configured for proper switch operations. Underlined items load other forms when selected. 4. Submit the form contents using the button on the bottom of the form. Button Description Submit When selected, the form is sent to the switch.
Input error checking The BBI performs two levels of input error-checking, as follows: Submit: When you click Submit on a Configuration form, the BBI checks the format and range of pending configuration changes. For example, if you enter a value that is out of range (VLAN = 8097), a log error is generated. Apply: When you click Apply to make pending changes active, the switch checks the validity of pending configuration changes.
Switch Management Processor Configuration Basic system configuration To display the following form, select System > General.
The following table describes the Switch Management Processor Configuration (basic) controls: Table 58 Switch Management Processor Configuration (Basic) controls Control Description Switch IP Address Configures the IP address of the switch interface using dotted decimal notation. Configures the IP subnet address mask for the interface using dotted decimal notation. Enables or disables the use of BOOTP. If you enable BOOTP, the switch will query its BOOTP server for all of the switch IP parameters.
SNMP controls To display the following form, select System > General.
The following table describes the Switch Management Processor Configuration (SNMP) controls: Table 59 Switch Management Processor Configuration (SNMP) controls Control Description SNMP System Name Configures the name for the system. The name can have a maximum of 64 characters. Configures the name of the system location. The location can have a maximum of 64 characters. Configures the name of the system contact. The contact can have a maximum of 64 characters. Configures the SNMP read community string.
User Configuration Table To display the following form, select System > User Table. This form summarizes the users configured on the switch. Click Add User to define a new user. Click Change User/Oper/Admin password to configure new passwords for the switch. To remove an end-user from switch, select the user ID and click Eject user.
User Access Control Configuration To display the following form, go to the User Configuration Table and click Add User. The following table describes User Access Configuration controls: Table 61 User Access Configuration controls Control Description User ID (1-10) Set Class of Service Set user name (1-8 chars) Set user password (1-128 chars) Re-type user password (1-128 chars) Enter current admin password User Status Sets a numeric identifier for the user.
Switch RADIUS Configuration To display the following form, select System > Radius. The following table describes Switch Radius Configuration controls: Table 62 Switch RADIUS Configuration controls Control Description Primary Radius IP Address Secondary Radius IP Address Radius port (1500-3000) Configures the primary Radius server address. Configures the secondary Radius server address. Configures the number of the UDP port to be configured, between 1500 3000. The default is 1645.
Switch TACACS+ Configuration To display the following form, select System > Tacacs+. TACACS+ (Terminal Access Controller Access Control System) is an authentication protocol that allows a remote access server to forward a user's logon password to an authentication server to determine whether access can be allowed to a given system. TACACS+ and Remote Authentication Dial-In User Service (RADIUS) protocols are more secure than the TACACS encryption protocol. TACACS+ is described in RFC 1492.
The following table describes Switch TACACS+ Configuration controls: Table 63 Switch TACACS+ Configuration controls Control Description Primary Tacacs+ IP Address Secondary Tacacs+ IP Address Tacacs+ port (1-65000) Configures the primary TACACS+ server address. Configures the secondary TACACS+ server address. Configures the number of the TCP port to be configured, between 1 and 65000. The default is 49.
NTP Configuration To display the following form, select System > NTP. This form enables you to synchronize the switch clock to a Network Time Protocol (NTP) server. By default, this option is disabled. The following table describes NTP Configuration controls: Table 64 NTP Configuration controls Control Description NTP Server IP Address Configures the IP address of the primary NTP server to which you want to synchronize the switch clock.
Syslog and Trap Feature Configuration To display the following form, select System > Syslog/Trap Features. The following table describes Syslog and Trap Feature Configuration controls: Table 65 Syslog and Trap Feature Configuration controls Control Description Enable/Disable Syslog and Trap of Console Enables or disables syslog messages and traps of console-related events. Enables or disables syslog messages and traps of system-related events.
Table 65 Syslog and Trap Feature Configuration controls Control Description Enable/Disable Syslog and Trap of RMON Enables or disables syslog messages and traps of Remote Monitoring (RMON) events. Enables or disables syslog messages of Uplink Failure Detection (UFD) events. Enables or disables syslog messages of configuration events. Enables or disables event traps of Uplink Failure Detection (UFD) events.
The switch software image is the executable code running on the switch. A version of the image ships with the switch, and comes pre-installed on the device. As new versions of the image are released, you can upgrade the software running on your switch.
Table 66 Switch Image and Configuration Management controls Control Description Username for FTP server of Blank for TFTP Server Password for FTP server Image Settings Image for Transfer Image Filename (on server) Enter the user name, if you want to upload to the FTP server. Remain the blank, if you want to upload to the TFTP server. Enter the password for the FTP server.
Management Network Definition Configuration To display the following form, select System > Mgmt. The following table describes the Management Network Definition Configuration controls: Table 68 Management Network Definition Configuration controls Control Description Index Management Network Address Displays the index number that identifies each management network. Adds a defined network through which switch access is allowed through Telnet, SNMP, or the Browser-based Interface (BBI).
Switch Ports Configuration To display the following form, select System > Switch Ports (click the underlined text, not the folder). This form summarizes the configuration of each port. Select a switch port number to go to its configuration form. Switch Port Configuration To display the following form, go to the Switch Ports Configuration form. Select a Switch Port number. This form allows you to configure settings for individual switch ports.
The following table describes the Switch Port Configuration controls: Table 69 Switch Port Configuration controls Control Description Switch Port State RMON Instrumentation Enables or disables the port. Enables or disables Remote Monitoring for the port. RMON must be enabled for RMON statistics and history sampling to function. Disables or enables VLAN tagging for this port. It is disabled by default. Disables or enables VLAN tag persistence.
Port-Based Port Mirroring Configuration To display the following form, select Port-Based Port Mirroring (click the underlined text, not the folder). This form is used to configure, enable, and disable the Monitoring Port. When enabled, network packets being sent and/or received on a target port are duplicated and sent to a monitor port. By attaching a network analyzer to the monitor port, you can collect detailed information about your network performance and usage.
Port Mirroring Configuration for Port To display the following form, go to the Monitoring Port x Configuration form. Select a Mirrored Port number, or click Add Mirrored Port. The following table describes the Port Mirroring Configuration for Port controls: Table 71 Port Mirroring Configuration for Port controls Control Description Mirrored Port Port Mirror Direction Adds the port to be mirrored. Specifies the direction of the traffic, either in or out.
Static FDB Configuration (part one) To display the following form, select Layer 2 > FDB >Static FDB (click the underlined text, not the folder). This form summarizes the Static Forwarding Database entries. Select a static FDB ID number to display the Static FDB Configuration form. Click Clear to clear the static FDB entries. Static FDB Configuration (part two) To display the following form, select Layer 2 > FDB >Static FDB > Add static FDB entry.
VLANs Configuration To display the following form, select Layer 2 > Virtual LANs (click the underlined text, not the folder). The following table describes the VLANs Configuration controls: Table 74 VLANs Configuration controls Control Description Search Range Search Options To search for a VLAN, enter a range of VLAN numbers in the From and To fields. To focus the search for a VLAN, enter optional search parameters: VLAN Name VLAN State Fields that have a value of “any” are ignored during the search.
VLAN Configuration To display the following form, go to the VLANs Configuration form. Select a VLAN ID, or open the Virtual LANs folder and click Add VLAN. The commands on this form configure VLAN attributes, change the status of the VLAN, delete the VLAN, and change the port membership of the VLAN. By default, the VLAN menu option is disabled except VLAN 1, which is enabled all the time. This switch supports a maximum of 1,000 VLANs. VLAN 4095 is reserved for switch management.
Switch Spanning Tree Groups Configuration To display the following form, select Layer 2 > Spanning Tree Groups (click the underlined text, not the folder). This form summarizes Spanning Tree Group parameters. This switch supports the IEEE 802.1d Spanning Tree Protocol (STP) and Per VLAN Spanning Tree (PVST+). You can configure up to 31 Spanning Tree Groups on the switch (STG 32 is reserved for switch management). Spanning Tree is turned on by default.
Switch Spanning Tree Group Configuration To display the following form, go to the Switch Spanning Tree Groups Configuration form. Select a Spanning Tree Group number, or open the Spanning Tree Groups folder and click Add Spanning Tree Group. Spanning Tree bridge parameters can be configured for each Spanning Tree Group.
The following table describes the Spanning Tree Group Configuration controls: Table 77 Switch Spanning Tree Group Configuration controls Control Description Spanning Tree Group ID (1-31) Selects a Spanning Tree Group to configure. Note: Spanning Tree Group 32 is reserved for switch management. Turns Spanning Tree on or off for the selected STP group. Configures the bridge priority. The bridge priority parameter controls which bridge on the network is the STP root bridge.
Switch Spanning Tree Group Port Configuration To display the following form, go to the Switch Spanning Tree Group Configuration form. Select a Switch Port number. Spanning Tree port parameters are used to modify STP operation on an individual port basis. By default for STP/PVST+, Spanning Tree is turned Off for downlink ports (1-16), and turned On for uplink and cross-connect ports (17-18, 20-24).
MSTP/RSTP General Configuration To display the following form, select Layer 2 > MSTP/RSTP > General. The switch supports the IEEE 802.1w Rapid Spanning Tree Protocol (RSTP) and IEEE 802.1s Multiple Spanning Tree Protocol (MSTP). MSTP allows you to map many VLANs to a small number of spanning tree groups, each with its own topology. You can configure up to 31 spanning tree groups on this switch. MSTP/RSTP is turned off by default.
Common Internal Spanning Tree Bridge Configuration To display the following form, select Layer 2 > MSTP/RSTP > CIST-Bridge. The CIST provides compatibility with different MSTP regions and with devices running different Spanning Tree instances. It is equivalent to Spanning Tree Group 0.
Ports Common Internal Spanning Tree Configuration To display the following form, select Layer 2 > MSTP/RSTP > CIST-Ports.
Common Internal Spanning Tree Port Configuration To display the following form, go to the Ports Common Internal Spanning Tree Configuration form. Select a CIST Port number. This form summarizes the port CIST parameters. Common Internal Spanning Tree port parameters are used to modify MSTP operation on an individual port basis. For each port, MSTP is turned on by default.
Trunk Groups Configuration To display the following form, select Layer 2 > Trunk Groups. This form provides a summary of the state of all trunk groups. Switch Trunk Group Configuration To display the following form, go to the Trunk Groups Configuration form. Select a Trunk Group number. This form enables you to configure a selected switch trunk group.
Trunk groups can provide super-bandwidth connections between switches or other trunk capable devices. A trunk is a group of ports that act together, combining their bandwidth to create a single, larger port. Up to 12 trunk groups can be configured on the switch with the following restrictions: Any physical switch port can belong to no more than one trunk group. Up to six ports/trunks can belong to the same trunk group.
LACP Configuration To display the following form, select Layer 2 > LACP. The following table describes the Switch LACP Configuration controls: Table 84 Switch LACP Configuration controls Control Description LACP System Priority (1-65535) Defines the priority value (1 through 65535) for the switch. Lower numbers provide higher priority. The default value is 32768. Timeout time Defines the timeout period before invalidating LACP data from a remote partner. Choose short (3 seconds) or long (90 seconds).
LACP Port Configuration To display the following form, go to the Switch LACP Configuration form. Select a port number. The following table describes the LACP Port Configuration controls: Table 85 LACP Port Configuration controls Control Description Port Admin Key Set the admin key for this port. Only ports with the same admin key and oper key (operational state generated internally) can form a LACP trunk group. Port Priority Sets the priority value for the selected port.
Uplink Fast General Configuration To display the following form, select Layer 2 > UpLink Fast. The following table describes the Uplink Fast Configuration controls: Table 86 Uplink Fast Configuration controls Control Description Enabled? Enables or disables Fast Uplink Convergence, which provides rapid Spanning Tree convergence to an upstream switch during failover. Note: When enabled, this feature increases bridge priorities to 65500 for all STGs and path cost by 3000 for all external STP ports.
RMON History Configuration Table To display the following form, select RMON > History (click the underlined text, not the folder). The following table describes the RMON History Groups Configuration controls: Table 87 RMON History Configuration controls Control Description Search Range Search Options To search for a History Group, enter a range of numbers in the From and To fields.
RMON History Configuration To display the following form, go to the RMON History Groups Configuration form. Select a History Group, or open the History folder and click Add History Group. The following table describes the History Group Configuration controls: Table 88 History Group Configuration controls Control Description History Group ID (1-65535) MIB Object ID Configures a numeric identifier for the selected History index. Configures the interface MIB Object Identifier.
RMON Alarm Configuration Table To display the following form, select RMON > Alarm (click the underlined text, not the folder). The following table describes the Alarm Groups Configuration controls: Table 89 RMON Alarm Configuration controls Control Description Search Range Search Options To search for a RMON Alarm, enter a range of numbers in the From and To fields.
RMON Alarm Configuration To display the following form, go to the RMON Alarm Groups Configuration form. Select an Alarm Group, or open the Alarm folder and click Add Alarm Group. The following table describes the Alarm Group Configuration controls: Table 90 Alarm Group Configuration controls Control Description Alarm Group ID MIB Object ID Configures the numeric identifier of the Alarm index. Configures an alarm MIB Object Identifier. The alarm OID can have a maximum of 127 characters.
RMON Event Configuration Table To display the following form, select RMON > Event (click the underlined text, not the folder). The following table describes the Event Groups Configuration controls: Table 91 RMON Event Configuration controls Control Description Search Range Search Options To search for a RMON Event Group, enter a range of numbers in the From and To fields.
RMON Event Configuration To display the following form, go to the RMON Event Groups Configuration form. Select an Event Group, or open the Event folder and click Add Event Group. The following table describes the Event Group Configuration controls: Table 92 Event Group Configuration controls Control Description Event Group ID Event Type Configures the numeric identifier of this Event index. Selects the type of notification provided for this event.
IP Interfaces Configuration To display the following form, select Layer 3 > IP Interfaces (click the underlined text, not the folder). This form summarizes IP Interface parameters. The following table describes IP Interfaces Configuration controls: Table 93 IP Interfaces Configuration controls Control Description Search Range Search Options To search for an IP Interface, enter a range of IP Interface numbers in the From and To fields.
IP Interface Configuration To display the following form, go to the IP Interfaces Configuration form. Select an IP Interface number, or open the IP Interfaces folder and click Add IP Interface. The switch can be configured with up to 256 IP interfaces. Each IP interface represents the switch on an IP subnet on your network. The Interface option is disabled by default.
Default Gateways Configuration To display the following form, select IP Menu > Default Gateways (click the underlined text, not the folder). This form summarizes default gateway parameters. The following table describes the Default Gateways Configuration controls: Table 95 Default Gateways Configuration controls Control Description Search Range Search Options To search for a Default Gateway, enter a range of Gateway numbers in the From and To fields.
Default Gateway Configuration To display the following form, go to the Default Gateways Configuration form. Select a Default Gateway ID, or open the Default Gateways folder and click Add Default Gateway. Default Gateways are disabled by default. The following table describes the Default Gateway Configuration controls: Table 96 Default Gateway Configuration controls Control Description Default Gateway Identifier (1-4) Default Gateway IP Address Selects a default Gateway to configure.
IGMP Snooping Configuration To display the following form, select Layer 3 > IGMP > IGMP Snooping (click the underlined text, not the folder). Internet Group Management Protocol (IGMP) is used by IP Multicast routers to learn about the existence of host group members on their directly attached subnet (see RFC 2236). IGMP Snooping allows the switch to forward multicast traffic only to those ports that request it. IGMP Snooping prevents multicast traffic from being flooded to all ports.
The following table describes the IGMP Snooping Configuration controls: Table 97 IGMP Snooping Configuration controls Control Descriptions IGMP on? Set report timeout Enables or disables IGMP Snooping. Configures the timeout value for IGMP Membership Reports (host). Once the timeout value is reached, the switch removes the host from its IGMP table, if the conditions are met. The range is from 1 to 255 seconds. The default is 10 seconds. Configures the timeout value for IGMP Membership Queries (Mrouter).
IGMP Filter Configuration To display the following form, go to the IGMP Filters Configuration form. Select a Filter ID, or open the IGMP Filters folder and click Add Filter. The following table describes the IGMP Filter Configuration controls: Table 98 IGMP Filter Configuration controls Control Description Filter Identifier (1 - 16) Enabled? Range 1 IP Multicast Address Range 2 IP Multicast Address Action Selects an IGMP filter to configure. Enables or disables this IGMP filter.
IGMP Filtering - Port Configuration To display the following form, go to the IGMP Filtering Port Configuration form. Select a Switch Port number. The following table describes IGMP Filtering – Port Configuration controls: Table 99 IGMP Filtering - Port Configuration controls Control Description Enable/Disable Filtering on Port IGMP Filters Available IGMP Filters Selected Enables or disables IGMP filtering on the port. Lists the filters that you can add to the port.
Static Multicast Router Configuration for Port To display the following form, go to the IGMP Static Multicast Router Configuration form. Select an Mrouter Port number, or open the IGMP Static Mrouter folder and click Add Mrouter. NOTE: When you configure a static multicast router on a VLAN, the process of learning multicast routers is disabled for that VLAN.
The following table describes the Domain Name System Configuration controls: Table 101 Domain Name System Configuration controls Control Description Primary IP Address Secondary IP Address Sets the IP address for your primary DNS server. Use dotted decimal notation. Sets the IP address for your secondary DNS server. If the primary DNS server fails, the configured secondary will be used instead. Enter the IP address using dotted decimal notation. Sets the default domain name used by the switch.
Uplink Failure Detection Configuration To display the following form, select Uplink Failure Detection (click the underlined text, not the folder). Uplink Failure Detection (UFD) supports network fault tolerance in network adapter teams. Use this menu to configure a Failure Detection Pair of one Links to Monitor (LtM) group and one Links to Disable (LtD) group. When UFD is enabled and a Failover Pair is configured, the switch automatically disables ports in the LtD if it detects a failure in the LtM.
Failure Detection Pair Configuration To display the following form, select Uplink Failure Detection (click the underlined text, not the folder). On the UFD Configuration form, select FDP. This information depends on the software version. One UFD is displayed on software version 1.0.0.
The following table describes the Failure Detection Pair Configuration controls: Table 104 Failure Detection Pair Configuration controls Control Description Enable/Disable FDP LtM Ports Available Enables or disables the Failover Pair. Lists the ports that can be added to the Link to Monitor (LtM). Only uplink ports (20-24) are allowed in the LtM. Lists the ports that are members of the LtM. Select a port number in the LtM Ports Available list and click Add to add the port to the LtM.