
User Manual


Table Of Contents
- Contact Us
- Introduction
- Home and Android Interface
- LinkRunner 10G Settings and Tools
- Software Management
- LinkRunner 10G Testing Applications
- AutoTest App and Profiles
- Ping/TCP Test App
- Capture App
- Discovery App
- Path Analysis App
- Performance Test App
- iPerf Test App
- Link-Live Cloud Service
- Cable Test App
- Specifications and Compliance
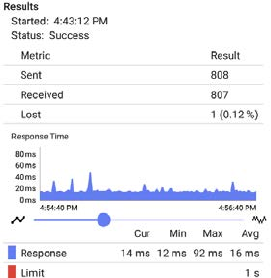
Trending Graphs
Many of the LinkRunner 10G testing apps
feature time-based line graphs of recorded meas-
urements, which you can pan and zoom to
view different time intervals. For example, the
image below shows the Response Time graph
from the Ping Test Results Screen.
These graphs update in real time and save and
display data for up to 24 hours (depending on
test type and/or link status).
General Settings and Tools
81