Netatmo User Manual Version 1 / S eptember 2012 An interactive version of this manual is embedded in your Netatmo iPhone/iPad/Android application. It is also available at http://my.netatmo.com on your personal account.
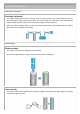
Tips and troubleshooting How does it all works? How does it all works? The outdoor module (the small one) wirelessly sends its measurements to the indoor module (the big one) using radio signal. Using your Wifi access point, the indoor module then sends both its own measurements and the outdoor module's measurements to your internet Netatmo personal account. When you launch the Netatmo App on your iPhone, those measurements are downloaded from your Netatmo personal account and displayed by the App.
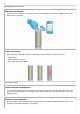
Measurements on demand Measuring on demand Touching on the top button of the indoor module instantly triggers measurements. Updated data is then directly sent to your iPhone. Direct CO2 reading When measuring on demand, the indoor module display CO2 level using the following color code: - Green = Good - Yellow = Could be improved - Red = Room should be ventilated.
Reason 2: weakened radio signal If the outdoor module is located too far away from the indoor module, or if both modules are separated by obstacles solid like concrete walls, data might not be transmitted correctly. In that case, make sure to bring the two modules closer from one another.
Reason 3: Wifi password has changed If you have changed your Wi-Fi password, the Netatmo weather station won't be able to connect to your Wi-Fi network anymore, and upload data to your account. To fix your Station's Wifi setup, just follow this link. Reason 4: Internet access is down The Netatmo Station can access your Wi-Fi router, but your internet access is not working. In that case, please check your internet access.
Minimum and maximum When you slide up or down the indoor panel in the dashboard, minimum and maximum temperatures will appear below the current temperature : minimum is indicated in green and maximum in red. Minimum and maximum temperatures actually are the higher and lower temperatures measured during the day, from midnight to midnight. Felt-like temperature In your Netatmo Dashboard is displaying felt-like temperature.
elevation, mountain elevation. To do so, the raw pressure measurements are adjusted by a standardized formula. The value resulting from this is called mean sea level pressure. Your Netatmo station displays the mean sea level pressure, meaning the pressure that the Netatmo station would measure if it were at sea level elevation. The mean sea level pressure is also the value given by weather forecast and reports on TV or Web.
If you blow into the station, the humidity level raises! What happens if the station gets soaked? When the weather is really humid (pouring rain...) the humidity sensor can be temporarily saturated. It usually takes a few hours to desaturate, and go back to normal. CO2 Sensor CO2 measurement By accumulation of gases from adhesives, cleaning products, smoke, dust, dust mites and mold in a confined space, your indoor air can rapidly become unhealthy.
Consequences CO2 is not dangerous when kept within such values. Nevertheless, when it rises over 1000 ppm, it is an indication that indoor air has not been renewed for a long time. If this happens, ventilating the room is a simple and effective action. Over 2000 ppm CO2 can also cause sleepiness and slight headaches. CO2 Alerts When the CO2 level rises above 1000 ppm, a first notification is sent to your iPhone/Android and the indoor module briefly lights up in yellow.
Current weather conditions Current weather icon The current weather condition is estimated, using the latest up-to-date information available at your station's precise location. 7-day forecast Forecast The Netatmo App offers a complete 7-days detailed weather forecast. It is localized according to your Netatmo Weather Station location and transmitted from our servers throught Internet and to your Netatmo App. This weather forecast data is provided by MeteoGroup.
The Rain mode gives you: the amount of rain per 3 hours period (represented by blue bars) and the probability of rain (represented as a red curve). EPA air index (USA) Outdoor air quality index The outdoor air quality index AQI is displayed on the outdoor dashboard. Complementary information By touching on the "..." button in the air quality gauge, you can display complementary information: main pollutant and hour of the report.
The AQI is divided into six categories: "Good" AQI is 0 - 50. Air quality is considered satisfactory, and air pollution poses little or no risk. "Moderate" AQI is 51 - 100. Air quality is acceptable; however, for some pollutants there may be a moderate health concern for a very small number of people. For example, people who are unusually sensitive to ozone may experience respiratory symptoms. "Unhealthy for Sensitive Groups" AQI is 101 - 150.
"Moderate" AQHI is 4 - 6. At Risk Population: Consider reducing or rescheduling strenuous activities outdoors if you are experiencing symptoms. General Population: No need to modify your usual outdoor activities unless you experience symptoms such as coughing and throat irritation. "High" AQHI is 7 - 10. At Risk Population: Reduce or reschedule strenuous activities outdoors. Children and the elderly should also take it easy.
Understanding the Citeair indices Those indices have 5 levels using a scale from 0 (very low) to > 100 (very high) and are a relative measure of the amount of air pollution. They are based on 3 pollutants of major concern in Europe: particles (PM10), nitrogen-dioxyde (NO2), and ozone (O3) and will be able to take into account to 3 additional pollutants (CO, PM2.5 and SO2) where data are also available.
Understanding the Citeair index This index has 5 levels using a scale from 0 (very low) to > 100 (very high), it is a relative estimation of the amount of air pollution. It is based on 5 pollutants of major concern in Europe: particles (PM10), nitrogen dioxyde (NO2), ozone (O3), carbon monoxyde (CO) and sulfur dioxyde (SO2). This index is a background estimated index representing the overall pollution level.
Indoor comfort index Your indoor comfort is computed from indoor temperature, humidity, CO2 and acoustic comfort. When the CO2 is high, the temperature too cold or too hot, the room too dry, or too noisy, your indoor comfort index deteriorates. Notifications What are notifications? Notifications are computed by your Netatmo Weather Station and sent to your iPhone/Android. They are implemented to help you improve your environment with daily basic actions.
What are highlights? Highlights are personalized analysis based on a week's measurements data: every week-end, 1 or 2 remarkable facts are highlighted from your station's raw data. Highlights are displayed in the event timeline of the Netatmo App. Example Your Netatmo station can detect temperature degradation over several weeks, CO2 peaks, large pressure variations... Graphs Automated recording Your Netatmo station is automatically and constantly recording measurements.
Scroll the graphs You can explore past measurements by scrolling the graphs left or right with a finger.