
Quick Reference Guide
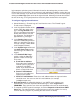
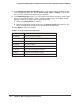
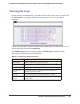
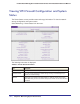
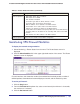
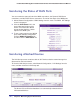
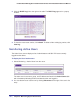

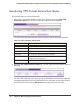
Table Of Contents
- ProSafe Dual WAN Gigabit Firewall with SSL & IPsec VPN FVS336Gv2
- Table of Contents
- Introduction
- Connecting the VPN Firewall to the Internet
- Understanding the Connection Steps
- Logging into the VPN Firewall
- Navigating the Menus
- Configuring the Internet Connections
- Automatically Detecting and Connecting
- Manually Configuring the Internet Connection
- Configuring the WAN Mode (Required for Dual WAN)
- Network Address Translation
- Classical Routing
- Configuring Auto-Rollover Mode
- Configuring Load Balancing
- Configuring Dynamic DNS (Optional)
- Configuring the Advanced WAN Options (Optional)
- Additional WAN Related Configuration
- LAN Configuration
- Choosing the VPN Firewall DHCP Options
- Configuring the LAN Setup Options
- Managing Groups and Hosts (LAN Groups)
- Viewing the LAN Groups Database
- Adding Devices to the LAN Groups Database
- Changing Group Names in the LAN Groups Database
- Configuring DHCP Address Reservation
- Configuring Multi Home LAN IP Addresses
- Configuring Static Routes
- Configuring Routing Information Protocol (RIP)
- Firewall Protection and Content Filtering
- About Firewall Protection and Content Filtering
- Using Rules to Block or Allow Specific Kinds of Traffic
- About Services-Based Rules
- Viewing the Rules
- Order of Precedence for Rules
- Setting the Default Outbound Policy
- Creating a LAN WAN Outbound Services Rule
- Creating a LAN WAN Inbound Services Rule
- Modifying Rules
- Inbound Rules Examples
- Outbound Rules Example
- Configuring Other Firewall Features
- Attack Checks
- Configuring Session Limits
- Managing the Application Level Gateway for SIP Sessions
- Creating Services, QoS Profiles, and Bandwidth Profiles
- Adding Customized Services
- Setting Quality of Service (QoS) Priorities
- Creating Bandwidth Profiles
- Setting a Schedule to Block or Allow Specific Traffic
- Blocking Internet Sites (Content Filtering)
- Configuring Source MAC Filtering
- Configuring IP/MAC Address Binding
- Configuring Port Triggering
- E-Mail Notifications of Event Logs and Alerts
- Administrator Tips
- Virtual Private Networking Using IPsec
- Considerations for Dual WAN Port Systems
- Using the VPN Wizard for Client and Gateway Configurations
- Creating Gateway to Gateway VPN Tunnels with the Wizard
- Creating a Client to Gateway VPN Tunnel
- Testing the Connections and Viewing Status Information
- NETGEAR VPN Client Status and Log Information
- VPN Firewall VPN Connection Status and Logs
- Managing VPN Policies
- Configuring IKE Policies
- Configuring VPN Policies
- Configuring Extended Authentication (XAUTH)
- Configuring XAUTH for VPN Clients
- User Database Configuration
- RADIUS Client Configuration
- Assigning IP Addresses to Remote Users (ModeConfig)
- Mode Config Operation
- Configuring Mode Config Operation on the VPN Firewall
- Configuring the ProSafe VPN Client for ModeConfig
- Configuring Keepalives and Dead Peer Detection
- Configuring Keepalives
- Configuring Dead Peer Detection
- Configuring NetBIOS Bridging with VPN
- Virtual Private Networking Using SSL
- Understanding the Portal Options
- Planning for SSL VPN
- Creating the Portal Layout
- Configuring Domains, Groups, and Users
- Configuring Applications for Port Forwarding
- Adding Servers
- Adding A New Host Name
- Configuring the SSL VPN Client
- Configuring the Client IP Address Range
- Adding Routes for VPN Tunnel Clients
- Replacing and Deleting Client Routes
- Using Network Resource Objects to Simplify Policies
- Adding New Network Resources
- Configuring User, Group, and Global Policies
- Viewing SSL VPN Policies
- Adding an SSL VPN Policy
- Managing Users, Authentication, and Certificates
- Adding Authentication Domains, Groups, and Users
- Creating a Domain
- Creating a Group
- Creating a New User Account
- Setting User Login Policies
- Changing Passwords and Other User Settings
- Managing Certificates
- Viewing and Loading CA Certificates
- Viewing Active Self Certificates
- Obtaining a Self Certificate from a Certificate Authority
- Managing your Certificate Revocation List (CRL)
- VPN Firewall and Network Management
- Performance Management
- Bandwidth Capacity
- Features That Reduce Traffic
- Features That Increase Traffic
- Using QoS to Shift the Traffic Mix
- Tools for Traffic Management
- Changing Passwords and Administrator Settings
- Enabling Remote Management Access
- Using the Command Line Interface
- Using an SNMP Manager
- Managing the Configuration File
- Reverting to Factory Default Settings
- Configuring Date and Time Service
- Monitoring System Performance
- Enabling the Traffic Meter
- Activating Notification of Events and Alerts
- Viewing the Logs
- Viewing VPN Firewall Configuration and System Status
- Monitoring VPN Firewall Statistics
- Monitoring the Status of WAN Ports
- Monitoring Attached Devices
- Viewing the DHCP Log
- Monitoring Active Users
- Viewing Port Triggering Status
- Monitoring VPN Tunnel Connection Status
- Viewing the VPN Logs
- Troubleshooting
- Basic Functions
- Power LED Not On
- LEDs Never Turn Off
- LAN or WAN Port LEDs Not On
- Troubleshooting the Web Configuration Interface
- Troubleshooting the ISP Connection
- Troubleshooting a TCP/IP Network Using a Ping Utility
- Testing the LAN Path to Your VPN Firewall
- Testing the Path from Your PC to a Remote Device
- Restoring the Default Configuration and Password
- Problems with Date and Time
- Using the Diagnostics Utilities
- Default Settings and Technical Specifications
- Network Planning for Dual WAN Ports
- What You Need to Do Before You Begin
- Cabling and Computer Hardware Requirements
- Computer Network Configuration Requirements
- Internet Configuration Requirements
- Where Do I Get the Internet Configuration Parameters?
- Internet Connection Information Form
- Overview of the Planning Process
- Inbound Traffic
- Virtual Private Networks (VPNs)
- The Roll-over Case for Firewalls With Dual WAN Ports
- The Load Balancing Case for Firewalls with Dual WAN Ports
- Inbound Traffic
- Inbound Traffic to Single WAN Port (Reference Case)
- Inbound Traffic to Dual WAN Port Systems
- Virtual Private Networks (VPNs)
- VPN Road Warrior (Client-to-Gateway)
- VPN Gateway-to-Gateway
- VPN Telecommuter (Client-to-Gateway Through a NAT Router)
- Two Factor Authentication
- Related Documents
- Notification of Compliance
- Index
Chapter 9: Monitoring System Performance | 155
ProSafe Dual WAN Gigabit Firewall with SSL & IPsec VPN FVS336Gv2 Reference Manual
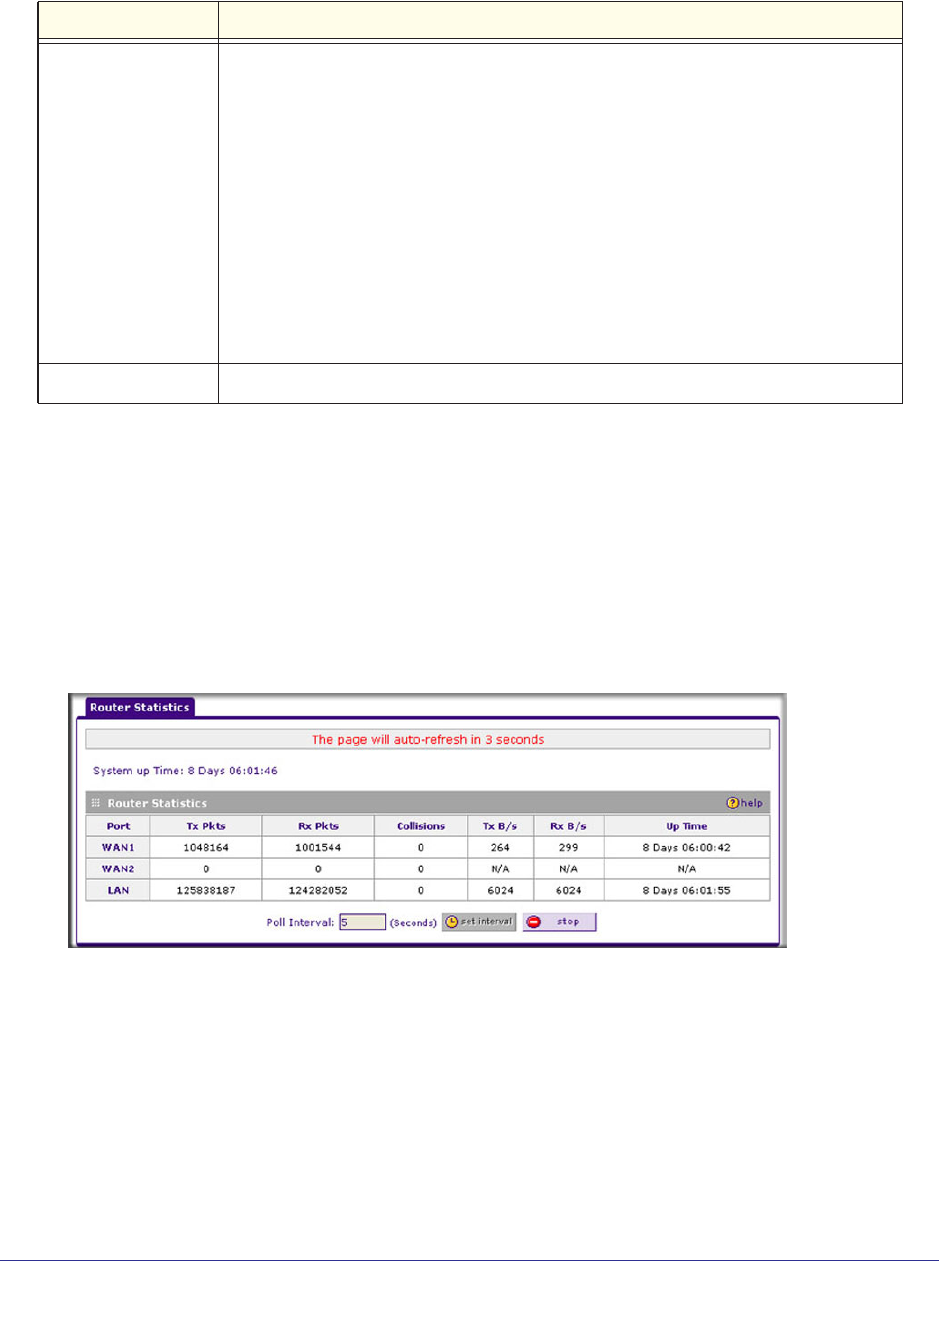
Monitoring VPN Firewall Statistics
To display the network storage statistics:
1. Select Monitoring > Router Status from the menu. The Router Status screen is
displayed.
2. Click the Show Statistics link in the upper right-hand section of the screen. The Router
Statistics screen is displayed.
For each interface, this shows the number of transmitted and received packets, number of
collided packets, transmitted and received Bytes per second, and the interface up-time.
To set the poll interval:
1. Click the Stop button.
2. From the Poll Interval drop-down list, select a new interval (the minimum is 5 seconds,
the maximum is 5 minutes).
3. Click the Set Interval button.
WAN1 Configuration • WAN Mode: Single, Dual, or Rollover.
• WAN State: UP or DOWN.
• NAT: Enabled or Disabled.
• Connection Type: Static IP, DHCP, PPPoE, or PPTP.
• Connection State: Connected or Disconnected.
• WAN IP Address: The IP address of the WAN interface.
• Subnet Mask: The IP subnet mask of the WAN interface.
• Gateway: The gateway IP address for the WAN interface.
• Primary DNS: The IP address of the primary DNS server for the WAN interface.
• Secondary DNS: The IP address of the secondary DNS server for the WAN
interface.
• MAC Address: The MAC address of the WAN interface.
WAN2 Configuration Displays the same details as for the WAN1 Configuration.
Table 9-3. Router Status Information (Continued)
Item Description