
User's Manual


Table Of Contents
- WFS709TP ProSafe Smart Wireless Switch Software Administration Manual
- Contents
- About This Manual
- Chapter 1 Overview of the WFS709TP
- Chapter 2 Deploying a Basic WFS709TP System
- Chapter 3 Configuring Network Parameters
- Chapter 4 RF Plan
- Chapter 5 Configuring WLANS
- Chapter 6 Configuring AAA Servers
- Chapter 7 Configuring 802.1x Authentication
- Chapter 8 Configuring the Captive Portal
- Chapter 9 Configuring MAC-Based Authentication
- Chapter 10 Adding Local WFS709TPs
- Chapter 11 Configuring Redundancy
- Chapter 12 Configuring Wireless Intrusion Protection
- Chapter 13 Configuring Management Utilities
- Chapter 14 Configuring WFS709TP for Voice
- Appendix A Configuring DHCP with Vendor-Specific Options
- Appendix B Windows Client Example Configuration for 802.1x
- Appendix C Internal Captive Portal
- Appendix D Related Documents
- Index
WFS709TP ProSafe Smart Wireless Switch Software Administration Manual
RF Plan 4-19
v1.0, June 2007
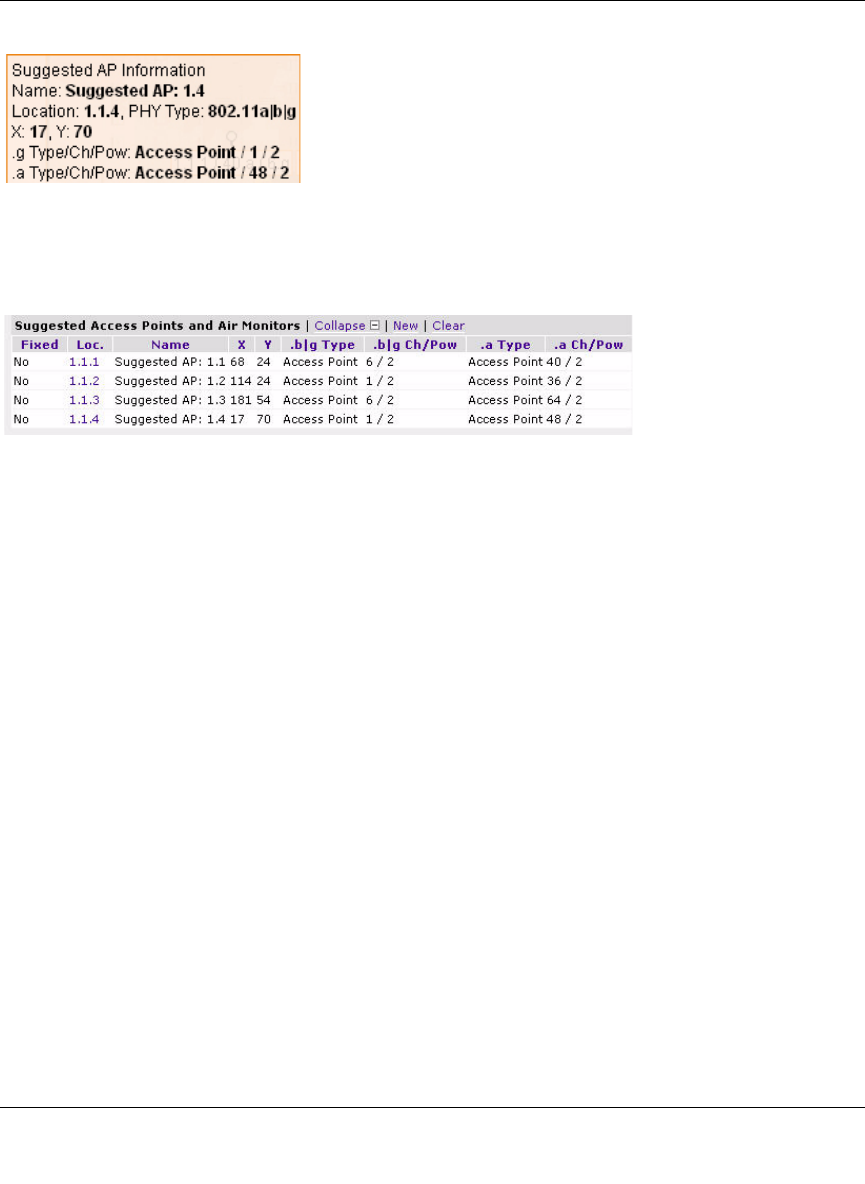
The Suggested Access Points and Air Monitors table (Figure 4-18) lists the coordinates, power,
location, power setting, and channel for each of the APs shown in the floor plan.
AM Planning Page
The AM Planning page calculates the optimum placement for the air monitors.
Initialize
Initialize the algorithm by clicking Initialize. This makes an initial placement of the AMs and
prepares RF Plan for the task of determining the optimum location for each of the AMs. When you
click Initialize, the AM symbols appear on the floor plan.
Start
Click Start to launch the optimizing algorithm. The AM symbols move on the page as RF Plan
finds the optimum location for each.
The process may take several minutes. Progress is displayed on the status bar of your browser. The
algorithm stops when the movement is less than a threshold value calculated based on the number
of AMs. The threshold value is also displayed in the status bar at the bottom of the browser
window.
Viewing the Results
Viewing the results of the AM Planning feature is similar to that for the AP Planning feature.You
can view the results of the optimizing algorithm two ways: graphically and in a table of suggested
Figure 4-17
Figure 4-18