
Quick Reference Guide


Appendix A. Report Templates | 239
ProSecure Web/Email Security Threat Management (STM) Appliance
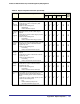
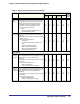
Infected
Malwares by
Month
For each Web server protocol separately, the number
of detected malware infections or infection attempts
per month for the time range that you specify in the
Filtering Options section of the Reports screen:
• Chart with the number of detected malware
infections or infection attempts per month
• Table with the following items:
- Month
- Number of detected malware infections or
infection attempts per month
User Activity Top users by number of blocked and allowed Web
requests:
• Chart with the number of blocked and allowed Web
requests per user
• Table with the following items:
- User identity
- Last time that the user was detected (“Last
seen”)
- Total number of Web requests
- Number of allowed Web requests
- Number of blocked Web requests
- Associated bandwidth usage
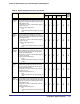
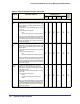
Email Activity
Top Spam
Senders by
Requests
For the blacklist and real-time blacklist combined and
for the distributed spam analysis separately, the top
spam senders by number of detected spam
messages:
• Chart with the number of detected spam messages
per sender
• Table with the following items:
- Sender’s email address
- Number of detected spam messages
Top Spam
Recipients
by Requests
For the blacklist and real-time blacklist combined and
for the distributed spam analysis separately, the top
spam recipients by number of detected spam
messages:
• Chart with the number of detected spam messages
per recipient
• Table with the following items:
- Recipient’s email address
- Number of detected spam messages
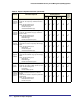
Table 63. Report Templates Information (Continued)
Activity Information Reported Filtering Options
Enable
logging
of HTTP
traffic
Client IP
Address
User Domain Web
Categories
Applications