
Network Router User Manual
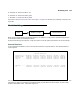
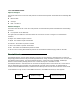
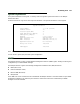
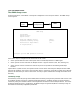
Table Of Contents
- Contents
- Introduction
- Making the Physical Connections
- Connecting to Your Local Area Network
- Configuring TCP/IP
- Console-Based Management
- WAN and System Configuration
- Monitoring Tools
- Security
- Utilities and Diagnostics
- Troubleshooting
- Binary Conversion Table
- Further Reading
- Technical Specifications and Safety Information
- Glossary
- Index
- Limited Warranty and Limitation of Remedies
Monitoring Tools 7-53
R: The letter “R” means the LED is red.
G: The letter “G” means the LED is green.
Y: The letter “Y” means the LED is yellow.
The section “Netopia D-Series DSL DSU status lights” on page 2-18 describes the meanings of the colors for
each LED.
SS
SS
tt
tt
aa
aa
tt
tt
ii
ii
ss
ss
tt
tt
ii
ii
cc
cc
ss
ss
&&
&&
LL
LL
oo
oo
gg
gg
ss
ss
When you are troubleshooting your Netopia D-Series, the Statistics & Logs screens provide insight into the
recent event activities of the Netopia D-Series.
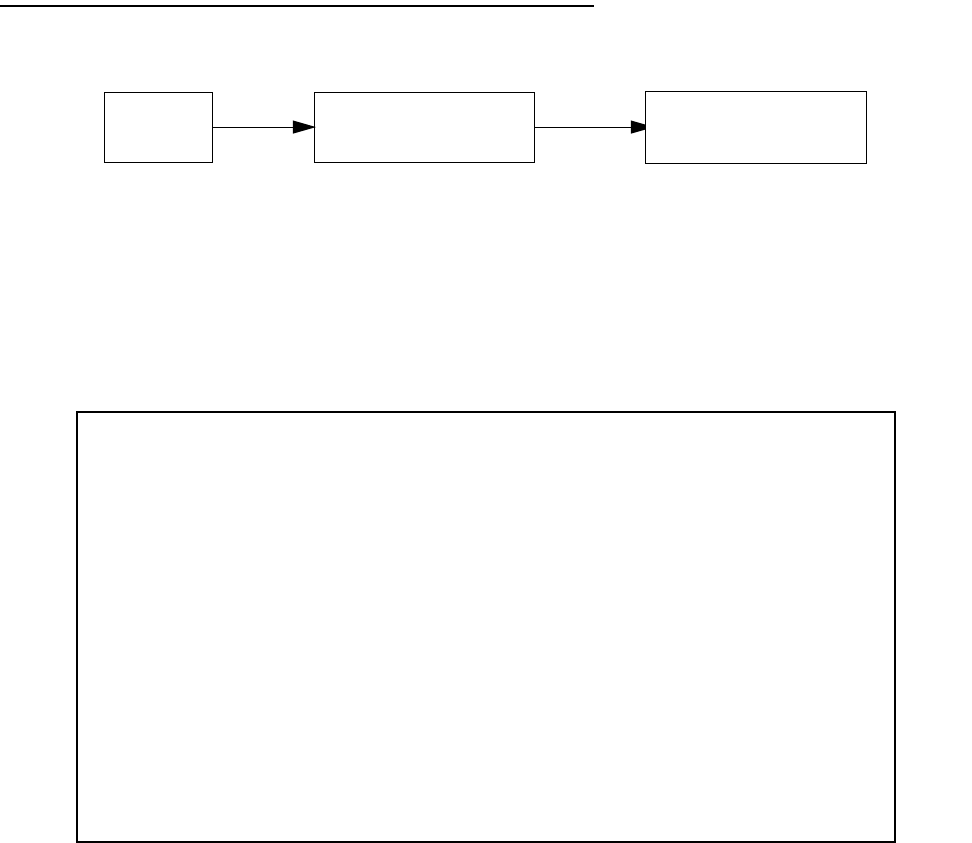
From the Main Menu go to Statistics & Logs and select one of the options described in the sections below.
GG
GG
ee
ee
nn
nn
ee
ee
rr
rr
aa
aa
ll
ll
SS
SS
tt
tt
aa
aa
tt
tt
ii
ii
ss
ss
tt
tt
ii
ii
cc
cc
ss
ss
To go to the General Statistics screen, select General Statistics and press Return. The General Statistics
screen appears.
The General Statistics screen displays information about data traffic on the Netopia D-Series’s data ports. This
information is useful for monitoring and troubleshooting your LAN. Note that the counters roll over at their
maximum field width, that is, they restart again at 0.
General StatisticsStatistics & Logs
Main
Menu
General Statistics
Physical I/F----Rx Bytes---Tx Bytes---Rx Pkts---Tx Pkts----Rx Err----Tx Err
Ethernet Hub 123456789 123456789 12345678 12345678 12345678 12345678
Aux Sync 123456789 123456789 12345678 12345678 12345678 12345678
IDSL 1 123456789 123456789 12345678 12345678 12345678 12345678
Network----------Rx Bytes---Tx Bytes---Rx Pkts---Tx Pkts----Rx Err----Tx Err
IP 123456789 123456789 12345678 12345678 12345678 12345678