
Gigabit Switch Getting Started

Chapter 3 Device Manager basics 53
Getting Started with the BayStack 380-24F Gigabit Switch Management Software
Working with statistics and graphs
Device Manager collects a wide range of statistics for each switch and each port.
You can view and graph statistics for a single object or multiple objects. For
information about the statistics tracked for the switch and ports, refer to Using the
BayStack 380-24F Gigabit Switch.
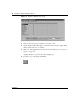
This section describes the types of statistics and graphs available, the graph dialog
boxes, and the procedure for creating a graph.
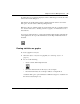
Types of statistics
The data tables in the statistics dialog boxes list the counters, or categories of
statistics being gathered, for the specified object. For example, the categories for
ports include Interface, Ethernet Errors, Bridge, and Rmon. Each category can be
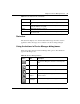
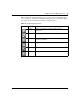
associated with six types of statistics (Table 11).
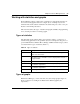
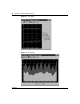
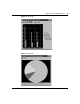
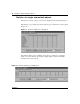
Types of graphs
With Device Manager, you can create line, area, bar, and pie graphs. Figure 27,
Figure 28, Figure 29, and Figure 30 illustrate the different graph styles,
respectively.
Table 11 Types of statistics
Statistic Description
AbsoluteValue The total count since the last time counters were reset. A system
reboot resets all counters.
Cumulative The total count since the statistics window was first opened. The
elapsed time for the cumulative counter is displayed at the bottom of
the graph window.
Average The cumulative count divided by the cumulative elapsed time.
Minimum The minimum average for the counter for a given polling interval over
the cumulative elapsed time.
Maximum The maximum average for the counter for a given polling interval over
the cumulative elapsed time.
LastValue The average for the counter over the last polling interval.