
Gigabit Switch Getting Started

Chapter 3 Device Manager basics 59
Getting Started with the BayStack 380-24F Gigabit Switch Management Software
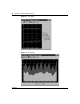
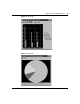
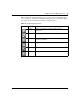
Buttons at the top of the graph dialog boxes for line, area, and bar graphs allow
you to change the orientation of the graph, change the scale, or change the graph
type. Table 12 describes the buttons in the graph dialog boxes.
Table 12 Graph dialog box buttons
Button Name Description
Stacked “Stacks” data quantities instead of displaying them
side-by-side.
Horizontal Rotates the graph 90 degrees.
Log Scale Changes the scale of the x-axis (of an unrotated graph) from
numeric to logarithmic.
Line Chart Converts an area graph or bar graph to a line graph.
Area Chart Converts a line graph or bar graph to an area graph.
Bar Chart Converts a line graph or area graph to a bar graph.