
Gigabit Switch Getting Started


Chapter 4 Web management interface basics 69
Getting Started with the BayStack 380-24F Gigabit Switch Management Software
Content area
The content area displays tables of information with buttons that you use to
configure and monitor the switch. Some tables may be too big to fit the displayed
page area. In these cases, use the scroll bars at the side and bottom to view the
entire table.
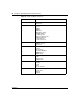
Icons
Some pages contain icons that allow you to modify information in a statistical
table or to display statistics in chart format. Table 16 describes the icons.
Table 16 Page icons
Icon Name Description
Modify Modifies the row.
Help Opens online Help.
Delete Deletes a row.
Pie chart Displays the statistics as a pie chart.
Bar graph Displays statistics as a bar graph.
Line graph Displays statistics as a line graph.