
User Guide


OmniTek XR User Guide, Software Release 2.3 Page 61
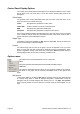
Colour Mode menu
This lists the different forms of waveform display that exist. This duplicates the
Colour mode selection offered through the optional control panel. The controls are
duplicated for user convenience. Note however that although you can select any
mode from this menu, you will still need to access the control panel to select the
specific components for display.
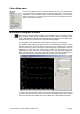
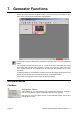
Waveform Histogram Window
The Waveform Histogram window displays colour histograms of the video that is currently
being analysed. These provide a detailed and accurate method of assessing colour
gamut. Unlike traditional displays that simply indicate that a signal is out of gamut, these
histograms allow you to see to how far out of gamut the signal goes.
The histograms can be represented either through a line graph or as a bar graph.
The standard display typically just shows a section of each histogram, scaled to suit the
selected window size. Scroll bars allow the full extent of the histograms to be viewed.
There is however the option to show these sections alongside a representation of the full
histogram in a ‘Split view’ (see ‘Options menu’ below). The area selected for more
detailed display is then marked on the full histogram and can be adjusted by dragging the
sides of the marked area. The Options menu also provides control over the display of the
graticule, labels and the summary information shown to the right of each graph.
In common with the Waveform window, the Waveform Histogram window has a panel of
controls on the right hand side of the window, which can be displayed or hidden. Several
of these controls are also available in the Colour Mode menu offered within this window.