
Datasheet


K8AK-PH
7
Checking Operation
Phase Sequence
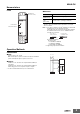
Switch the wiring, as shown by the dotted lines in the
connection diagram, to reverse the phase sequence and
check that the K8AK operates.
Phase Loss
Create a phase loss for any input phase and check that the
K8AK operates.
Connection Diagram
Can phase loss be detected on the load side?
In principle, phase loss cannot be detected on the load side
because the K8AK-PH measures three-phase voltage to
determine phase loss.
Is it possible to detect phase losses for motor loads while
the motor is operating?
Phase loss can be detected while the motor is operating.
However, the detection conditions depend on the load
conditions that are shown in the following figure. Understand
these characteristics when using this feature.
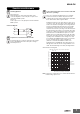
Normally, three-phase motors will continue to rotate even if
one phase is open. The three-phase voltage will be induced
at the motor terminals. The diagram shows voltage induction
at the motor terminals when phase R has been lost with a
load applied to a three-phase motor. The horizontal axis
shows the motor load as a percentage of the rated load, and
the vertical axis shows voltage as a percentage of the rated
voltage. The solid line in the graph shows the voltage that is
induced at the motor terminals when a phase loss occurs
while the motor is operating under various loads. The figure
below shows how a phase loss that occurs while the motor is
operating causes an imbalance in the voltage across each
motor terminal. The K8AK-PH detects phase loss when the
motor is operating when the voltage is unbalanced.
(Detection occurs when the imbalance is 80% of the
maximum phase). The K8AK-PH cannot detect phase loss
with light motor loads because the voltage imbalance is too
small. The detectable range is shown by the diagonal lines.
Characteristic Curve Diagram
Note: For phase loss of phase R. V
ST, VTR, and VRS indicate the motor
terminal voltage at phase loss.
Questions and Answers
Q
L1 L1
L2 L2
L3 L3
3φ,
200 VAC
Q
Q
100
95
90
85
80
75
70
65
60
55
50
45
10 0 20 30 40 50 60 70 80 90
100 110
VST
VTR
VRS
Note: This characteristic curve shows the approximate
values only.
Voltage (as a percentage of rated voltage)
Motor load (as a percentage of rated load)
Detectable
area