
Quick Start Guide

¿D²À,oF Áµ
'ÀD#
RUXhi`_^?^fY8adZe^f\dg v\d`bX^
>ÎòÜêøÖ?Þ·êøÚÔÛ
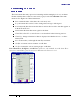
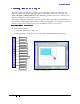
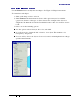
The format menu has many options for formatting and fine tuning the look of your charts.
Double-click the chart so that it is enclosed by a gray border. Click Format in the main
menu list. See Figure 24: Chart format menu.
Ë
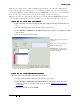
Title formats the titles of the chart, the x axis and y axis.
Ë
Legend formats the location, borders, background, and type of the legend.
Ë
Axis formats the lines that create the chart as well as the font of the text that appears on
both the X and Y axes.
Ë
Grid formats the lines that create a grid for the chart.
Ë
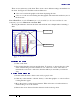
Chart Wall, Chart Floor, and Chart Area are described in the following sections.
Ë
Chart Type changes what kind of chart is displayed and whether it is two- or three-
dimensional.
Ë
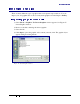
Auto Format takes you through the AutoLayout feature.
Ë
3D Effects formats various elements of a 3D chart.
Ë
3D View formats the various viewing angles of 3D chart.
Note: Chart Floor, 3D Effects, and 3D View options are only available for a 3D chart. These
options are unavailable (grayed out) if a two-dimensional chart is selected.
!#" $%'& ()*+,&-+/. 01)232546" $87:9;#<);>=?6" @ Ìà
Figure 24: Chart format menu