Draw Guide Drawing Vector Graphics in OpenOfce.org This PDF is designed to be read onscreen, two pages at a time. If you want to print a copy, your PDF viewer should have an option for printing two pages on one sheet of paper, but you may need to start with page 2 to get it to print facing pages correctly. (Print this cover page separately.
Copyright This document is Copyright © 2005–2010 by its contributors as listed in the section titled Authors. You may distribute it and/or modify it under the terms of either the GNU General Public License, version 3 or later, or the Creative Commons Attribution License, version 3.0 or later. All trademarks within this guide belong to their legitimate owners.
Contents Chapter 1 Introducing Draw.......................................................................6 Introduction........................................................................................ 7 The Draw workplace........................................................................... 8 Rulers.................................................................................................. 9 Status bar........................................................................................
Using styles....................................................................................... 71 Special efects................................................................................... 72 Chapter 5 Combining Multiple Objects.....................................................78 Introduction: grouping and combining objects.................................79 Grouping objects............................................................................... 79 Combining objects....................
Color palette: adding or changing single colors.............................165 Changing colors using the Color dialog..........................................167 Creating cool efects....................................................................... 169 Chapter 9 Organization Charts, Flow Diagrams, and More....................171 Drawing an organization chart.......................................................172 Drawing a fow diagram.................................................................
1 Chapter Introducing Draw
Introduction Draw is a vector graphics drawing tool, although it can also perform some operations on raster graphics (pixels). Using Draw, you can quickly create a wide variety of graphical images. Vector graphics store and display a picture as simple geometric elements such as lines, circles, and polygons rather than as a collection of pixels (points on the screen). This permits simpler storage and supports precise scaling of the picture elements. Draw is fully integrated into the OpenOfce.
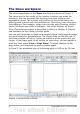
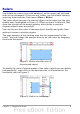
The Draw workplace The main components of the Draw interface are shown in Figure 1. The large area in the center of the window is where you make the drawings. You can surround the drawing area with toolbars and information areas. The number and position of the visible tools vary with the task in hand and user preferences. Therefore, your setup may look diferent. For example, many users put the main Drawing toolbar on the left-hand side of the workspace—not at the bottom, as shown here.
Rulers You should see rulers (bars with numbers) on the upper and left-hand sides of the workspace. If they are not visible, you can enable them by selecting them from the View menu (View > Ruler). The rulers show the size of a selected object on the page (see the gray double lines, highlighted in Figure 2). When no object is selected, they show the location of the mouse pointer, which helps to position drawing objects more accurately.
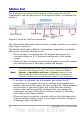
Status bar The Status bar is located at the bottom of the screen (in all OOo components) and includes several Draw-specifc felds, as identifed in Figure 4. Figure 4: Items on the Draw status bar The Information feld shows which action is being carried out, or which object type is selected.
In the Indicator feld, an asterisk (*) is shown whenever any change is made to the document but not yet saved to disk. If you wish to digitally sign the document, a double-click or right-click in the Signature feld brings up the signature box. Note that a document must be saved at least once before it can be signed. After it is signed, an indicator is present in this feld. The Slide feld shows the sequence number for the current drawing page, in addition to the total number of pages that you created so far.
Toolbars You can display or hide the various Draw toolbars, according to your needs. To display or hide a toolbar, click View > Toolbars. On the menu that appears, choose which toolbars you want to display. You can also select the icons that you wish to appear on the toolbars. Toolbars display a default selection of icons but you can choose to hide some of these and display others. To change the visible icons on any toolbar, click the arrow at the right-hand end of the toolbar and select Visible Buttons.
Writer. A more detailed explanation of the buttons on this toolbar can be found in Chapter 4 (Changing Object Attributes). Figure 8: Text Formatting toolbar Drawing toolbar The Drawing toolbar is the most important toolbar in Draw. It contains all the necessary functions for drawing various geometric and freehand shapes and for organizing them on the page. It is described in detail in Chapter 2 (Drawing Basic Shapes).
Figure 11: Displaying the Area dialog from the menu bar A more detailed description of color palettes and their options can be found in Chapter 8 (Tips and Tricks). . 14 Figure 12. Changing the color palette OpenOfce.org 3.
Options toolbar The Options toolbar lets you activate or deactivate various drawing aids. The Options Bar is not one of the toolbars displayed by default. To display it, select View > Toolbars > Options.
The options are described in the table above and in greater detail in other chapters of the Draw Guide. Drawing grid and guides Draw ofers a grid as a drawing aid. The grid can be turned on or of by clicking on the Grid icon on the Options toolbar. The points of the grid displayed on the screen are not shown on the printed drawing. The color, spacing, and resolution of the grid points can be individually chosen for each axis.
Figure 14: An arrow next to an icon indicates additional functions. Tip When you double-click on an icon on a foating toolbar, the command corresponding to that icon will run. You can then repeat this action as often as you like. To exit from this mode, press the Esc key or click on another icon (for example ). This may not work for every icon on every toolbar. Similarly, click on the arrow on the title bar of a foating toolbar to display additional functions (see Figure 15).
Customizing toolbars You can customize toolbars in several ways, in addition to those described in the previous section. For example, you can add functions to a toolbar, move tools between toolbars, and create new toolbars. To do this, choose View > Toolbars > Customize, select the Toolbars tab (Figure 16) and the toolbar you want to change, and then select the desired buttons for that toolbar. Each toolbar has a diferent list of buttons. For details, see Chapter 14 (Customizing OpenOfce.
2 Chapter Drawing Basic Shapes
Creating simple drawings You can create 2D and 3D objects in Draw. This chapter shows how to draw simple 2D objects. The following chapters describe how to work with and edit such objects. All shapes, whether they are lines, rectangles, or more complicated shapes, are called objects. This is common notation in vector drawing software. The drawing tools are found on the Drawing toolbar. Figures 17 and 30 show parts of the standard form of the toolbar, as installed with Draw.
Note When you draw a basic shape or select one for editing, the Information feld in the status bar changes to refect the action taken or in progress: Line created, Text frame xxyy selected, TextEdit: Paragraph 1, Row 1, Column 8 and so on. Figure 17 shows part of the Drawing toolbar with the icons needed in the following sections. The Text icon is also included. Figure 17: Part of the Drawing toolbar Drawing a straight line We begin with the drawing of the simplest element—a straight line.
Keeping the Ctrl key pressed while drawing a line enables the end of the line to snap to the nearest grid point. Caution The efect of the Ctrl key depends on the settings of the Snap to Grid option on the View->Grid menu: Snap to Grid on: Ctrl deactivates the snap option for this activity. Snap to Grid of: Ctrl activates the snap option for this activity. The spacing (resolution) of the grid points can be adjusted under Tools > Options > OpenOfce.org-Draw > Grid. See also Chapter 8 (Tips and Tricks).
description of the current activity or selection is shown when you are working with elements. Figure 19 shows two examples. Drawing an arrow Arrows are drawn like lines. Draw classifes arrows as a subgroup of lines: lines with arrowheads. The information feld on the status bar shows them only as lines. Click on the Line Ends with Arrow icon to draw an arrow.
Starting point Figure 21: Drawing a rectangle Draw considers squares to be rectangles with sides of equal length. Hold down the Shift key to draw a square. Hold down the Alt key while dragging with the mouse to create a rectangle with its center (rather than a corner) at the start point (where you frst clicked the mouse). Note Blue or green selection handles appear around an object made up of more than 2 points, showing that this is the currently selected object.
• Holding down the Ctrl key while dragging with the mouse draws an ellipse or circle that snaps to the nearest grid points. Note If you frst press and hold the Ctrl key down and then click on one of the icons for Line, Rectangle, Ellipse or Text, a standard sized object is drawn automatically in the work area: the size, shape, and color are all standard values. These attributes can be changed later, if desired.
4) On the Customize dialog, ensure that the checkbox by the new Ellipse command is selected, and then use the up and down arrow buttons to move it to the desired position on the toolbar. 5) To remove the simple Ellipse icon from the Drawing toolbar, click to highlight it in the Customize dialog, and press the Delete key (or click the Modify button and choose Delete from the dropdown menu). 6) Click OK to complete the process. You should now see this Ellipse icon on the Drawing toolbar.
Note Hovering the mouse pointer over this icon gives a tooltip of Curve. If you convert the icon to a foating toolbar, however, the title is Lines, as shown in Figure 25. Polygon, Filled Polygon (45°), Filled Freeform Line, Filled Curve, Filled Freeform Line Curve Polygon Polygon (45°) Figure 25: Floating Curves toolbar (incorrectly titled “Lines”) If you move the mouse cursor over one of the icons, a tooltip pops up with a description of the function.
icon on the Drawing toolbar and then move the mouse pointer over the object. Most objects have four gluepoints, as shown in Figure 26. You can add more gluepoints, and customize gluepoints, using the toolbar of the same name (Figure 27). Figure 26: Four gluepoints Figure 27: Gluepoints toolbar Gluepoints are not the same as the little blue or green “handles” of an object.
Figure 28: A connector between two objects Draw ofers a range of diferent connectors and connector functions. Open the foating Connectors toolbar by clicking on the arrow next to the Connector icon (Figure 29).
Note If you select shapes for editing, the information feld in the toolbar shows the type of shape selected and, if more than one object is selected, the total number. Figure 30 shows part of the Drawing toolbar with the icons referred to in the following sections. Clicking on the arrow next to the icon opens a foating toolbar with the relevant work tools.
Block arrows The Block Arrows icon Arrows toolbar. opens the Block Flowcharts The tools for drawing fowcharts are accessed by clicking on the Flowcharts icon . The creation of fowcharts, organization charts, and similar planning tools are described in Chapter 9 (Organization Charts, Flow Diagrams, and More). Callouts Use the Callouts icon Callouts toolbar. , to open the Stars and banners These tools are associated with the Stars icon . You can add text to all these shapes.
Adding text to objects Draw ofers two ways to add text to a drawing: in a dynamic text frame as an independent Draw object or as text in a previously drawn object. In the latter case, the text is integrated with the object.
Figure 32: Text input in a dynamic text frame Observe the information feld in the status bar: it shows that you are editing text and also provides details about the current cursor location —paragraph, line, and column numbers. Text properties can also be changed during text input. Any changes will be refected from the cursor position onwards (Figure 33).
The exceptions to this are control elements like buttons or list boxes, as well as 3D scenes and their associated elements and groups. If the Double-click to edit Text icon on the Options toolbar is active, you can start editing an object by double-clicking on it (or by pressing F2). In the middle of the Draw object, a black bar indicates the text cursor; start typing to input text. The status bar shows at the lower left “Text Edit” and the position of the cursor within the text.
3 Chapter Working with Objects and Object Points
Introduction This chapter looks at the tools and functions that let you modify existing drawings. All of the functions apply to a selected object or group of objects, which can be distinguished by small colored squares or circles located around it. These points are called handles. The handles form a rectangular frame that is just big enough to contain the object. Where several objects are selected, the frame around them corresponds to the smallest rectangle that can contain all of the objects.
When the Points button is active, the default mode is for selections to be edited; these selections are indicated by blue squares. Some objects will have one or more extra handles, which are larger or colored diferently. This is explained in more detail in “Editing object points” on page 46. Selections for rotating objects are indicated by small red circles and a symbol representing the center of rotation.
Selection by framing You can also select several objects at once by using the mouse to drag a large rectangle around the objects with the Select button, as shown. For this to work, the icon on the Drawing toolbar must be active. Only objects that lie entirely within the rectangle will be selected. Selecting hidden objects Even if objects are located behind others and not visible, they can still be selected. Hold down the Alt key and click where the object is located.
Arranging objects In a complex drawing, several objects may be stacked on top of one another. To rearrange the stacking order (move an object to the front or to the back of the stack), select the object, click Modify > Arrange and choose Bring Forward or Send Backward. Or right-click the object, choose Arrange from the context menu, then choose Bring Forward or Send Backward. These options are also available from the Arrange tear-of toolbar accessible from the icon on the Drawing toolbar.
changes as the mouse is moved. The units of measurement are those selected under Tools > Options > OpenOfce.org Draw > General. Dynamic movement of objects To move an object, select it and then click within the object’s border and hold down the left mouse button while dragging the mouse. During movement, the shape of the object appears as dotted lines to help with repositioning. To drop the object at its new location, release the mouse button. The new position appears immediately in the Status Bar.
Figure 38: The Information feld during dynamic size modifcation of objects In the case of a rectangle, the new size is shown as percentages of the original x and y dimensions. For a line, much more information is given: the absolute change in x and y coordinates of the end point being moved, together with the current length and bearing of the modifed line. These are updated dynamically as the end point is moved (see Figure 38).
If you click and hold the mouse button when the hand cursor appears, moving the mouse will change the location of the start or end point of the arc. The actual coordinates are shown in the Status Bar (see lower left graphic in Figure 38. Rotating and shearing an object using the mouse Use the red rotation handles to either rotate an object around an axis or slant or shear the object. Rotating To rotate an object (or a group of objects), drag a red corner handle point of the selection with the mouse.
Changing inclination or perspective To slant or shear objects, use the red handles located at the midpoint of an edge of the selected objects. The mouse pointer changes to a when the pointer hovers over one of these midpoint handles. Not every object can be slanted—basic shapes can be rotated but not slanted. The slant axis is the point directly opposite the midpoint handle to be used for shearing the object.
As with rotation, you can make the slanting occur in steps of 15° by pressing the Shift key while moving the handle. Setting size and position exactly You can position and resize objects with the mouse, but this method is not very exact. If you need accurate positioning of objects, use Format > Position and Size from the menu bar, or right-click the object and select Position and Size from the context menu, or press F4.
Tip The Keep ratio checkbox is very useful. Click it to keep the ratio of width to height fxed while you change the size of an object. Either or both the size and position can be protected so that they cannot be inadvertently changed. Check the appropriate boxes to achieve this. Tip You cannot move an object? Check to see if the position is protected! Rotating objects Click on the Rotation tab of the Position and Size dialog (see Figure 43).
Figure 45: Setting rounded corners and slant angle Corner radius Figure 46: Example of setting rounded corners You can use this dialog to round the corners of the usual Draw objects —text boxes, legends, rectangles, and squares, as shown in Figure 46. The same efect can be achieved when you are in the points mode (by clicking the Points icon on the Drawing toolbar), by dragging the large handle with the mouse. The larger the value for the corner radius, the more round will be the object.
You can also convert the shapes to a polygon (Convert > To Polygon). With polygons, the edge points are always connected with straight lines and not with curves. Some of the techniques described work equally with polygons as with curves. An alternative way to change the form of basic shapes In current versions of Draw, many of the new shapes can be directly edited without having to convert them to curves frst.
How curves work The editing of curves depends on the mathematics of Bézier curves1. The complete study of such curves goes beyond this scope of this guide, and only the basics are covered here. Chapter 10 (Advanced Draw Techniques) provides more information on drawing and manipulating Bézier curves. The editing of a Bézier curve consists in principle of moving points or tangents passing through these points. Each tangent has two control points—one at each end—and a junction point where it meets the curve.
1 2 3 4 Points Move Points Insert Points Delete Points 5 6 7 8 Split Curve Convert to Curve Corner Point Smooth Transition 9 Symmetric Transition 10 Close Bézier 11 Eliminate Points Figure 50: Edit Points toolbar On this toolbar, icons may be active or inactive depending on the selected object and object point. With the Convert to Curve icon, you can determine for individual points whether their connection will be made with straight lines or with curves.
Figure 53: Infexion point It is also possible to completely detach both sides of the tangent. In this case, the central point is known as the infexion point. Using this technique, you can draw spikes and troughs in objects. Choose the Corner Point button to create an infexion point around the selected point. Examples The other buttons in the Edit Points Toolbar are described here in relation to working examples. The following examples start from a flled circle.
To change the direction or location of the tangents, move the circular handles at each end. The mouse pointer then looks like this: Figure 55: Rotating a tangent Use the Add Points button to add an extra edit point to an existing curve. Click on the curve at the spot where you want to insert a point and then move the mouse slightly in any direction while holding down the button. Watch out! If you just click, the new point will not be added.
➊ ➋ 3 Use the Split Curve button to split or cut a curve at the location of the selected handle. If the object is flled, it will be emptied because the curve that represented the edge is no longer closed. Check that you have selected the correct handle (➊), click the Split Curve button (➋) and notice that the object is no longer flled. You can then check, by moving the point, that the curve has indeed been separated (➌).
➊ ➋ The Select button on the Drawing toolbar functions as a switch. It works as follows. If you have two points linked together by a straight line (you do not need to have a curve between the points) and you insert a new point between them that is set at an angle to the initial straight line (and hence the two endpoints), then: • If the Select button is active, you will have a drawing similar to that illustrated in ➊.
The Rotate function from the Efects drop- ➊ down button on the Drawing toolbar and the Rotation Mode after Clicking Object button on the Options toolbar can be used in Edit Point mode. In this case, it can be used to move single points around the contour of an object. Switch into rotation mode by clicking on either of the rotation buttons. Notice that in rotation mode, all of the tangent points become red dots.
4 Chapter Changing Object Attributes
Toolbars and menus To change an object’s attributes (such as color, border width, among others) you can use the Line and Filling toolbar or the context menu. Line and Filling toolbar If the Line and Filling toolbar is not visible, you can display it using View > Toolbars > Line and Filling. From here you can edit the most common object attributes. You can also open the Line dialog by clicking on the Line icon and the Area dialog by clicking on the Area icon to see more options.
Figure 66: Right-click on an object to see the context menu Editing lines and borders Lines, arrows, and the borders of an object are managed through the same dialog (Figure 67). Figure 67: Lines and borders You can change some properties from the Line and Filling toolbar. To see more options, select the object and right-click on the object and choose Line from the context menu. This opens the Line dialog.
Figure 68: Line dialog (right-click on an object and choose Line). Common line properties In most cases the property you want to change is the line’s style (solid, dashed, invisible, and so on), its color, or its width. These options are all available from the Line and Filling toolbar. Figure 69: Common line options (style, width, color) You can also edit these properties from the Line dialog. They are on the frst tab, left column (see Figure 68).
Drawing arrows Arrowheads (and other line endings—usually referred to in this guide collectively as arrows) are a line property. Select a line and click on the Arrow Style icon. This opens the Arrowheads menu. Figure 71: Arrowheads menu There are several types of arrowheads available. Each end of the line can have a diferent arrowhead (or no arrowhead). Note Arrowheads are only applicable to lines. They have no efect on an object’s border.
Customizing line and arrow styles You are not constrained to using only the line and arrow styles provided by default in Draw. You can modify the styles and create your own. Customizing line styles In the Line dialog, click on the Line Styles tab (see Figure 73). From here you can customize the line styles or create your own (click on the Add button to create your own). You can change the length of the dashes, the space between them, and other attributes.
Figure 74: To create your own arrowhead, you must frst draw a curve. Note The arrowhead must be a curve. A curve is something you could draw without lifting a pencil. For example, is a curve but is not a curve. You can however draw forms which are not curves and then at the end convert them to a curve. Select the curve, open the Line dialog, and go to the Arrow Styles page. Click on Add, enter a name for the arrow style and click OK (see Figure 75).
Figure 76: Arrow style list Editing the inside (fll) of an object The OpenOfce.org term for the inside of an object is Area fll. The area fll of an object can be a uniform color, a gradient, a hatching pattern, or an image. It can be made partly or wholly transparent and can throw a shadow. Figure 77: Diferent types of area fll Common fll properties In most cases, you will choose one of the standard fll options, whether it is a color, a gradient or an image.
Figure 78: Common fll options Fill with a uniform color Select the object you wish to edit. On the Line and Filling toolbar, select Color on the pull down list at the right of the paint can, and then choose a color from the right-hand menu. Figure 79: Filling with a color Fill with a gradient Select the object you wish to edit. On the Line and Filling toolbar, select Gradient and then choose a gradient from the right-hand menu.
Fill with a line pattern The OOo term for line patterns is Hatching. Select the object you wish to edit. On the Line and Filling toolbar, select Hatching and then choose an option from the menu. Figure 81: Filling with a line pattern Fill with an image You can fll an object with a bitmap image (as opposed to a vector graphic image). Select the object you wish to edit. On the Line and Filling toolbar, select Bitmap and then choose an option from the menu. Figure 82: Filling with an image 64 OpenOfce.
Adding a shadow In Draw, shadows are considered an area property. Click on the Filling icon on the Line and Filling toolbar—next to the area fll functions (Figure 83). Figure 83: Adding a shadow Advanced area fll options Click on the Area icon to bring up the Area dialog. From this dialog, you can fne tune the area fll of an object in greater detail. Creating your own fll color Click on the Colors tab of the Area dialog (Figure 84). From here you can modify existing colors or create your own.
and Black. Click on Add to add this color to the color table. Clicking on the Modify button will change the values of the current color (here it is Blue 8, shown in the upper rectangle) to those on the screen in the lower rectangle. The Edit button allows you to fne tune the color using a palette with visual feedback. Further explanation about color palettes can be found in Chapter 8 (Tips and Tricks). Creating your own gradient On the Area dialog, click on the Gradients tab.
Then choose a type of gradient. There are several available (Linear, Axial, Radial, and so on) and each has up to four diferent options to specify it in detail. For example, a radial gradient has a center you can specify (Figure 87). Figure 87: Center option in a radial gradient Figure 88 shows how an ellipsoid gradient is rotated, moved vertically and horizontally, and the color of the border area varied.
Figure 89: Modifying hatchings Creating your own bitmap fll You can add your own bitmap images to fll an area. First, you need to create the bitmap image. This could be a photo or another sketch you have created in another program. For example, you can draw something with Draw and export it as a PNG format image fle. To export a PNG image fle: Create the image, select it, then choose File > Export, choose PNG from the pulldown list of fle formats, give the fle a name, and save it.
From there you can add new bitmap images to serve as area flls. Click on Import and choose a fle you previously saved. Give it a name that will make it easy to remember. The last imported image will appear at the bottom of the pulldown list of bitmap flls. Now you can use that image as an area fll. Figure 91: Adding your own bitmap images Tip If the imported image seems to be very small in the preview in Figure 91 probably you forgot to select the image before you exported it.
Shadows can also have transparency, so the shadow does not hide objects behind it. Figure 93: Shadow with 50% transparency Adding transparency You can make objects partly or fully transparent, or even a with a varying degree of transparency (as a gradient). On the Transparency page (Figure 94), choose Transparency (for a uniform transparency) or Gradient for a gradient transparency. Figure 94: Transparency page of Area dialog An example of gradient transparency is shown in Figure 95.
Using styles Suppose that you want to apply the same area fll, line thickness, and border to a set of objects. This repetitive process can be greatly simplifed by the use of styles. Styles allow you to defne a formatting template (a style) and then to apply that style to multiple objects. For more about styles, see Chapter 6 (Introduction to Styles) in the Writer Guide.
Tip Question: What happens if I modify a style after it has been applied? Answer: Then every object with that style is updated automatically! Modifying a style Modifying a style is similar to creating a new style. Select an object with that style and change the area and line properties. When satisfed, click on the Update Style icon . Special efects First make sure that the Drawing toolbar is selected (View > Toolbars > Drawing). On the Drawing toolbar, locate the Efects icon .
Grab one of the handles and move it to rotate the object. The black circle in the middle of the object is the pivot (center of rotation). You can move the location of the pivot with the mouse. Flip an object Select an object and click on the Flip icon . You will see a dashed line through the middle of the object. This dashed line is the axis of symmetry. The object will be refected about this line. Move one or both ends of the line with your mouse to set the orientation of the axis.
Figure 98: Making a mirror copy of an object Distorting an image There are three tools on the Efects menu that let you drag the corners and edges of an object to distort the image. The Distort tool distorts an object in perspective, the Set to Circle (slant) and Set in Circle (perspective) tools both create a pseudo three-dimensional efect. The results of using these tools are shown in the following fgures. Distort an object Select an object and click on the Distort icon .
Set in circle (perspective) Select an object and click on the Set in Circle (perspective) icon. Draw will ask if you want to transform the object to a curve. This is a necessary step before distortion, so click Yes. Then you can move the object handles to give a pseudo three-dimensional perspective). Figure 100: Set an image in a circle with perspective Set to circle (slant) Select an object and click on the Set to Circle (slant) icon. Draw will ask if you want to transform the object to a curve.
Note Transforming an object into a curve is a safe operation, but it cannot be reversed other than by clicking the Undo button. Dynamic gradients You can control transparency gradients in the same manner as color gradients. Both types of gradient can be used together. With a transparency gradient, the direction and degree of an object’s fll color changes from opaque to transparent (in a regular gradient, the fll changes from one color to another, but the degree of transparency remains the same).
A single color object and a transparency gradient, covering part of the underlying object. The gradient can be dynamically adjusted, made more transparent by moving the white square or more opaque by moving the black square. An object with a color gradient, completely covering another object. The gradient is adjusted dynamically by moving the squares – the color of the square relating to the increase or decrease in that color.
5 Chapter Combining Multiple Objects
Introduction: grouping and combining objects Using Draw, you can combine drawing objects together in two distinct ways: grouping and combining. These two methods allow you to treat multiple objects as one unit, or to merge objects to form a new shape. Grouping is like putting objects in a container. You can move them as a group and apply global changes to them. A group can always be undone and the objects that make up the group can always be manipulated separately.
Figure 103: Grouping objects using the right-click menu The objects of a group retain their own individual properties. To undo a group, right-click and choose Ungroup from the pop-up menu, use the keyboard shortcut Control+Alt+Shift+G or choose Modify > Ungroup from the menu bar. Editing individual objects in a group You can edit a member of a group individually without breaking the group. To do this, right-click and choose Enter group or double-click on the group.
Nesting groups You can create “nested” groups, or groups of groups. In this case, Draw keeps the initial group hierarchy. If you ungroup a group made of other groups, you are left with individual groups that you can then ungroup further, and so on until only single objects remain. Combining objects In contrast to grouping functions, combinations create a new object; subsequent “un-combining” in the same manner as ungrouping is not possible.
Tip You can reorder objects so they are further back in the background or further forward in the foreground: right-click on the object and select Arrangement from the pop-up menu. See also “Aids for positioning objects” on page 84. An object which is a combination can be broken up into its constituent parts by selecting Modify > Break. This is not the equivalent of ungrouping as the objects were converted to Bézier curves when they were combined.
Tip How do I move an object so it is further back or closer to the front? See page 84. Practical example The following example shows how you can use the merge functions to create a complex shape, namely a knife with a wooden handle. 1) Draw an ellipse and then a rectangle overlapping half of its width. 2) Select both shapes, right-click, and choose Shapes > Subtract from the pop-up menu. The result should resemble the shape at right: 3) Draw another rectangle and put it over the top half of the ellipse.
Aids for positioning objects Draw has various tools to help you arrange the objects with respect to each other. Here we explore some of the more important ones. Moving an object to the front or to the back When you combine or merge objects, the end result varies drastically depending on which object is “in front” and which one is “in the back”. In Figure 108 you can see the diference. Figure 108: Subtracting objects: the result varies depending on which object is in front.
brings the selected object to the front of the group. brings the selected object one step upwards. sends the selected object one step backwards. sends the selected object to the back of the group. moves the selected object in front of another chosen object. moves the selected object behind another chosen object. Click frst on the object you want to change in position. Next click on the icon and then move the mouse over the other object.
reverses the order of the selected objects. Aligning objects Select two objects and long-click on on the Drawing toolbar to open the Align toolbar. This toolbar can be torn of and made to foat. The tools help you position objects with respect to each other. 1 Align left 2 Center horizontally 3 Align right 4 Align top 5 Center vertically 6 Align bottom Figure 110: The foating Align toolbar Align left. Center horizontally. Align right. 86 OpenOfce.org 3.
Align top. Center vertically. Align bottom. If you have selected only one object, clicking the various buttons on the Align toolbar positions the object in relation to the drawing page. Distributing the distance and space between objects Select at least three objects. Now you are able to select the option Distribution on the Modify menu or from the right-click menu. The Distribution dialog contains a number of options, described below.
Spacing. The horizontal spacing between the objects is evenly distributed. Right. The right edges of the objects are evenly spaced from one another. Vertical distribution None. Does not distribute the objects vertically. Top. The top edges of the objects are evenly spaced from one another. Center. The vertical centers of the objects are evenly spaced from one another. Spacing. The vertical spacing between the objects is evenly distributed. Bottom.
6 Chapter Editing Pictures (Raster Graphics)
Introduction Earlier chapters of the Draw Guide have dealt only with vector graphics. However, Draw also contains a number of functions for handling raster graphics (bitmaps) such as photographs and scanned pictures, including import, export, and conversion from one format to another. Draw can read all the usual graphics fle formats. It has a subset of the same capabilities as specialized raster graphics programs like Adobe Photoshop or The Gimp.
To link or to embed? If you select the Link option in the Insert picture dialog, the graphic is linked rather than embedded. It is not actually inserted into the document; instead, a link to the graphic is created. This link is relative to the folder where the document is stored, even though it shows up in the Edit Links dialog (see Figure 115) as an absolute link.
Scanning With most scanners you can directly insert a scanned picture into a document. Choose Insert > Picture > Scan and then either Select Source or Request. The Select Source option opens a window which acts as an interface to a scanner device. Some scanner options can be directly set from within this window. See Figure 116. Figure 116: Select source ..... Scanner Click on Create Preview to carry out a preview scan. The results are shown in the preview box on the left.
Dragging and dropping Drag and drop also functions in many situations. The exact way drag and drop works is determined not by whether the graphic is to be embedded or linked but by the operating system in use and the source of the graphic. The behavior can be controlled by the use of the Control or Control+Shift keys together. Draw objects and images which are used frequently can be stored in the Gallery. Objects can be dragged from the Gallery to the Draw surface quite simply.
Choose the object or objects (multiple selection using the Control or Shift key is possible). If the inserted object was named in the source document, it keeps its original name unless the name already exists in the current document. In that case you must give the object a new name before it is inserted. To rename an inserted object, right-click and choose Name from the pop-up menu. Renaming has the advantage that the object is then listed in the Navigator.
Figure 119: Lower part of the Export dialog Exporting single objects In order to export individual drawing objects, you need to frst select them. A selection can include more than one object. Take care to choose the Selection option on the Export dialog. Exporting as a vector graphic The choice of vector formats is still limited. An export to a DXF format fle (Autocad) is not yet possible.
Figure 120: Adjusting format specifc properties prior to export The actual number of pixels used is determined by the screen resolution set up by the operating system and the Drawing scale factor set in Tools > Options > OpenOfce.org Draw > General. This is a limitation of the current user interface; it is possible to set other resolutions using macros.
Tip To avoid problems when scaling Draw objects containing text after importing them into Writer, convert the object to a polygon before storing it in the Gallery or copying it to the clipboard. See “Convert to a polygon” on page 110. Modifying raster object properties As with other objects, the properties of a raster graphic can be modifed. You can format the graphic using the Format menu or the context menu.
The following table explains the individual functions on the Picture toolbar and illustrates their use with examples. Filter Opens the Filter toolbar, which is described in “The graphic flter toolbar” on page 101. Graphics Mode Use the Graphics mode menu to change the display of the graphic from normal color to grayscale, black and white, or a watermark. This setting afects only the display and printing of the picture; the picture itself remains unchanged.
The Gamma value afects the brightness of the middle color tones. Values can range from 0.10 (minimum) to 10 (maximum) Hint: Try adjusting this value if changing brightness /contrast does not give you the result you want. Transparency The degree of transparency of the picture can be adjusted between 0% (opaque) and 100% (fully transparent). Line Opens the Line dialog. In this context, line refers to the outline of the border. See also Chapter 4 (Changing Object Attributes). Area Opens the Area dialog.
Cropping Figure 123: The Crop dialog More control and accuracy over cropping functions are available via the Format menu. Click Format > Crop Picture and the dialog box in Figure 123 will appear. The felds Left, Right, Top, and Bottom establish the amount to be trimmed of the appropriate edge. In addition to cropping, you can also enlarge or reduce the size of the graphic by changing the percentage scaling values.
menu has an option for keeping the width:height ratio fxed while changing one of the two dimensions.) Changing values in one area (Scale or Image Size) will show up correspondingly in the other area. Caution Any changes made in the Crop dialog change only the view of the picture. The original picture is not changed. If you want to export a cropped graphic, you must do it through File > Export. If you use the option Save as Picture from the context menu, the changes are not exported.
Sharpen increases the contrast between neighboring pixels, emphasizing the brightness diference. This will accentuate the outlines. The efect will be strengthened if you apply the flter several times in a row. Remove noise compares every pixel with its neighbors and replaces the extreme values (those that deviate in color by a large amount from a mean value) by a pixel with a mean color value.
Aging lends pictures a certain “look” resembling that of old photos. The process frst produces a grayscale picture from the original and then reduces the intensity of the blue and green color values, so that the fnal picture appears darker and redder. In the middle example, the aging degree was set to 0%, at right it was 15%. Posterize reduces the number of colors in the picture. The fewer colors, the more fat the picture appears. In the right picture below the number of colors was reduced to 8.
Charcoal sketch makes the picture appear as if it had been drawn with charcoal. The outlines are in black and the original colors are suppressed. The Relief flter calculates the edges in relief of the picture and produces a picture as if illuminated by a light source, the position of the illuminating light being variable and producing shadows in diferent directions and magnitude. Mosaic takes groups of pixels and converts them into a single color rectangular tile. The whole picture appears to be a mosaic.
Caution If your picture is linked, flters are applied only to the current view. The stored picture is not changed. When you close the document, all fltering is lost. You should ensure that you export the picture to create a copy with all the flters applied (File > Export). If you have embedded the graphic in the document, all flters are applied directly on the embedded graphic and cannot be undone in a subsequent session.
Open the Eyedropper dialog with Tools > Eyedropper and click on the picture to be edited. Now click on the icon , to change to the color selection mode. Outside the dialog the cursor changes to a hand. The feld next to the icon shows the color immediately under the hand cursor. Click on the color to be changed. The frst Source Color box is now marked and the color selected appears in the left box. In the Replace with selection list, the option Transparent is already selected.
The selection list for replacement colors shows all the available colors in the current color palette of the document. You cannot defne any new colors here but you can add colors to the available palette before using the eyedropper tool. For more on this topic, see Chapter 8 (Tips and Tricks). Efect of the tolerance parameter The tolerance parameter describes how closely a color value in the picture must agree with the source color in order to be replaced.
Reducing color depth Original with a 24 bit pixel depth (=8 bits per channel) 1 bit dithered The impression of grayscale is produced by a raster. In reality there are only two colors. 1 bit threshold The threshold determines which pixels are black and which are white.
4 bit grayscale palette 8 bit color palette With 8 bits a total of 256 colors can be produced. The image at left is at frst glance very difcult to distinguish from the original. A big diference is that the picture fle is only one third of the size of the 24 bit version. 8 bit grayscale palette Conversion Convert to a contoured image Select the picture so you see the green handles. From the context menu or from the Modify menu choose Convert > to Contour.
Convert to a polygon Select the picture so you see the green handles. From the context menu or from the Modify menu, choose Convert > to Polygon. This command converts areas of the same color into small flled polygons. The total image becomes a vector graphic and can be resized with no loss of image quality or distortion of text. The resulting format will be a Metafle. The Convert to Polygon dialog has a number of settings which can be tested using the Preview button.
Point reduction Polygons will only be created if they have a size greater than the value given in this setting. The section of the picture below, highly magnifed, shows that with a larger point count small fecks of color—typical of irregular color patterns—simply disappear. 2 Pixel 3 Pixel Fill holes Point reduction can result in small areas or “holes” which are not covered by a polygon.
Here the picture is transformed with the Poster flter, but this time with a point reduction of 4 pixels and a tile size of 16 pixels. The efect below was generated from the picture to the left (posterized and vectorized); the polygons were split with Modify > Break, and a number (in this case 6) of the (foreground) polygons were deleted until the resulting background was achieved.
Using the graphic generated in the posterize and vectorize process above, Break and Split it, and then try out some operations using the tools on the Efects toolbar. To use this tool to vectorize the frst letter of a chapter in a special font, convert the graphic to a polygon, using no point reduction or background tiling. Use Modify > Break to generate two polyons. An example is shown below. Original polygon, converted from a Metafle. Break the graphic into two polygons.
Convert to bitmap All drawing objects are vector graphics. Use the command Convert > To Bitmap from the context menu to convert a vector graphic to a raster graphic. Draw creates the raster graphic in PNG format with a color depth of 24 bits. Unfortunately any transparency efects which were created in the vector graphic are lost in this conversion, although the PNG format used in Draw does support transparency. Only if you use the eyedropper tool to set transparency will an Alpha channel also be produced.
Figure 125: Options - OpenOfce.org Draw - Print Other options are in Tools > Options > OpenOfce.org > Print (see Figure 126). They relate to page options (scaling) and other printing variables. They afect the size of the print fle and the time taken to print the document. With most modern systems you can simply accept the defaults. As diferent operating systems and printers have their own requirements, you need to tailor the settings to your particular site conditions.
7 Chapter Working with 3D Objects
Creating 3D objects Although Draw does not match the functionality of leading drawing or picture editing programs, it is capable of producing and editing very good 3D drawings and pictures. Draw ofers two diferent types of 3D objects: 3D bodies and 3D shapes. Depending on which type you choose, there are diferent possibilities for further editing of the object (rotation, illumination, perspective). 3D shapes are simpler to set up and edit than 3D bodies, but 3D bodies currently allow for more customization.
Variation 2: Body rotation Choose a common drawing object, for example a (non-black) line. Then change this into a rotation body. Draw provides two methods to do this. Method 1. Click the icon in the Drawing toolbar (this icon is also usually not visible) or choose Modify > Convert > To 3D Rotation object. With this rotation method, the axis of rotation coincides with the left edge of the enclosing selection rectangle, through the green rectangle handles.
Variation 3: Using ready-made objects Use the 3D Objects toolbar/pulldown menu (Figure 130). To activate this toolbar, click View > Toolbars > 3D Objects). Figure 130: The 3D Objects toolbar If you add the icon to the Drawing toolbar, the 3D Object bar will be available as a pulldown menu or as a foating toolbar. After choosing the type of object, left-click on the starting point and drag the mouse diagonally until the outline of the object is the size you want.
Variation 4: Extrusion of shapes Figure 131: The Basic Shapes toolbar You use the Basic Shapes toolbar (or another shape toolbar) to produce 2D surfaces. Shapes such as cylinders or cubes are technically possible but not very useful, because they produce curiously curved images. If you have drawn a shape, the last icon on the Drawing toolbar is active. A click on this icon can transform a 2D surface into a 3D object (see Figure 132).
To open the Fontwork Gallery, use the icon on the Drawing toolbar. Figure 134: Extrusion Shapes from the Fontwork Gallery Note Draw objects of the type “Shape” cannot be viewed with OpenOfce.org Version 1.x. They are simply missing from the drawing. If you save a document with extruded shapes in the older *.sxw format, the shapes will be converted to 3D scenes.
Figure 135: 3D object rotation You can rotate the object about each axis (X,Y,Z). The X and Y axes are those parallel to the edges of the drawing layer, while the Z axis comes out of the page. It is not possible to change the axis orientation. The three axes are not shown directly, but the their intersection point. symbol indicates You want to … You must ... ... rotate the object about the X or Y axis. ... put the mouse cursor over the object.
Procedure for 3D shapes Objects produced using variations 4 and 5 (see above) can only be rotated about the Z axis when using the three methods described in the previous section. This rotation is carried out on the underlying 2D object. It is also possible to rotate the 3D object in the same way as with a 2D object using Format > Position and Size > Rotation (shortcut key for Position and Size is F4) and specifying the pivot point location and the number of degrees of rotation desired.
Figure 137: Upper part of the 3D Efects dialog Note Only the selected efects are assigned to the object. There is no object conversion; thus a cylinder cannot be transformed into a ring through the application of a 3D efect. However, it is possible to change the appearance to a wooden or metal body. By the assignment of a 3D efect, 2D objects are transformed into 3D objects. In order for the Efects dialog to take over all the current properties of the object, you must click the button.
With central projection (see Figure 139), Draw creates the object with three vanishing points. The parameters for central projection are set (indirectly) through the camera settings on the Shading dialog page. Figure 139: Figure shown using central projection. For clarity the projection lines have been added. 3D Efects - Geometry On the Geometry page, you can make changes to the geometry of a 3D object. This page is opened with the Geometry button part of the 3D Efects dialog.
Figure 140: Geometry page In the frst example, the depth (length) of a body is to be changed. This is possible only if you created it through extrusion. To illustrate: draw a circle and convert it according to Variation 1 into a 3D object (a fat cylinder); see Figure 141a and b. If necessary, select the cylinder, open the 3D Efects dialog, make sure the Geometry page is active, change the parameter Depth to 3.5cm and click on the Assign icon . The cylinder should now resemble the fgure in Figure 141c.
cylinder again and use the 3D Efects dialog to change the rounding to 30%. The cylinder should now resemble that in Figure 142. Figure 142: Edge rounding of 10% (a) and 30% (b) This parameter also has interesting efects when you convert text into a 3D object. The Scaled Depth parameter sets the size ratio of the front to the back for a 3D object produced by extrusion.
Figure 144: Scaling depth of a rotation body The Rotation Angle parameter is only available for rotation bodies. With this parameter you can create a segment of a complete rotation body by choosing an angle less than 360 degrees. Figure 145 shows a hemisphere with a rotation angle of 270°. Figure 145: Hemisphere with a rotation angle of 270° The Horizontal and Vertical Segments parameters defne the number of segments out of which Draw builds spheres and rotation objects2.
Figure 146: Sphere from 10 segments (left) and 25 segments (right) These are properties belonging to individual objects. If you use the setting for segments on a 3D scene, all the objects contained in the scene are modifed accordingly. If you extrude an unflled circle or intersecting lines with a flling the result may not be what you expect. In this case the Double-Sided tool, on the lower part of the dialog page, may be able to help.
Figure 148: Normals (vectors) of a 3D sphere with 10 segments Using normals, the display of the object surface and the variation in colors, textures and lighting can be controlled, infuencing directly how the surface of the object is rendered. The frst three icons in Figure 140 work as “either-or” switches. Only one of the efects can be active at a given time; an efect can be switched of by clicking on one of the other icons.
Figure 149: Cylinder with 10 segments a= Object-specifc b=Flat, c=Spherical The following table shows the linkage between double-sided illumination and inverted normals. The light source is on the right. Normals not inverted Normals inverted No double sided illumination With double sided illumination 3D Efects - Shading The Shading page ofers functions for shading the object surface, adding shadows and choosing camera settings.
Figure 150: Shading page • Gouraud is a relatively quick method. It determines the color value for the segment corners and calculates the color value for every pixel through linear interpolation. The segment edges are still recognizable, but importantly are less so than with the fat method. The Gouraud method considers only light refection on difuse, refecting surfaces (dispersal).
With the the Shadow button you can provide a 3D object with a shadow. By changing the Surface angle you can infuence the form of the shadow (see Figure 152). The left sphere has a surface angle of 0° (the paper represents a perpendicular surface behind the object) while the right sphere has a surface angle of 45°. With 90° the paper would be directly under the object. Figure 152: Shadows using diferent surface angles The shape and size of the the shadow are also infuenced by the lighting properties.
Figure 153: Efect of camera settings Picture a shows a 3D object with the standard settings. The individual changes are listed in the following table. Distance: Focal length: a b c d 0.81 cm 3.81 cm 0.81 cm 0.81 cm 10 cm 10 cm 5 cm 15 cm 3D Efects - Illumination On the Illumination page (see Figure 154) you defne how a 3D object is lit. The settings apply to all objects in a scene. Figure 154: Illumination (lighting) page 134 OpenOfce.org 3.
You can light a scene with a maximum of eight individual Light sources at the same time. For each of these sources the light color and position relative to the scene can be set. The light sources are represented by eight small light bulbs. When you select this page, the frst bulb “lights up” . At least one light source must be active; otherwise, the rendering and shading functions cannot function correctly. Each symbol functions like a multi-function press switch.
Figure 156: Moving the light source To apply the changed settings to the selected object, click on the the Assign button . The use of additional light sources can result in some interesting efects. Figure 157: Lighting with three independent light sources In Figure 157 the ring has the lighting settings from Figure 154 with the standard color white. In addition it was lit with magenta, and also from the left underside with yellow.
a further mouse click on the light source the efect can be switched back on and then re-assigned. You can also change the settings for the Ambient lighting. The selection of properties (lighting color, brightness, and so on) is carried out in same way as for light sources. 3D Efects - Textures Textures are raster graphics (bitmaps) which can be used as an object property for the surface of an object. Every object in a 3D scene can have its own texture.
In the frst row of the page (Figure 158) are two switches (Type) with which you can choose between black and white or color for the texture (see Figure 159). Figure 159: a - standard color setting, b - texture (color), c - texture (black and white) With the two switches in the row Mode you can control whether the texture of the selected objects is rendered with light and shadows (Switch 2) or not (Switch 1); see Figure 160.
For a rotation body, the turning axis is the Z axis and the wrapping is the X direction; for an extrusion body, the extrusion direction is the Z axis and the extruded surface is the X direction. Depending on how the object was produced, diferent positions of the texture result. OpenOf ce.org Projection X Projection X Projection X Area fll without tiling, with adjustments Projection Y Projection Y (Diference is small) Front and rear side Figure 161: Cylinder as a rotation body OpenOf ce.
3D Efects - Material On this page you can assign the appearance of diferent materials to the 3D object. Figure 163: Material menu In the selection list under Favorites are the most commonly used materials (see Figure 164). Figure 164: The favorites (from left to right): Metal, Gold, Chrome, Plastic and Wood With the individual color parameters, additional efects can be produced. The meaning of these parameters corresponds to those on the Illumination dialog page.
The Illumination color brightens those parts of the object which lie in shadow making the body seem more illuminated. When textures are used as well, the Illumination color is combined with the white color part of the texture. On the left the object has a black Illumination color, on the right bright green. The Specular color simulates the refecting capacity of the surface. The position of the illuminated point is determined by the setting of the frst light source.
Figure 165: 3D-Settings toolbar, indicating icons for formatting 3D shapes If you have used it in error, you can remove the incorrect formatting with Format > Default Formatting. With the buttons on this toolbar you can adjust the extrusion depth and perspective, lighting and material properties as well as the extrusion color. There are tear-of bars, which you open by clicking on the small black triangle. The purpose of each individual button is described by its tool tip.
Illumination The light color cannot be changed, the brightness can be changed only in three levels, and some efects may not be totally correctly rendered. left: from left under, dim middle: from left under, bright right: from right under, normal Surface Only four built-in variations are possible. At present only Wireframe and Matt are correctly rendered.
Combining objects in 3D scenes 3D objects produced by extrusion or rotation are shown in the status bar as a 3D scene. You can group together several of these objects. Other object types cannot be so grouped. Management of the group is carried out in the same way as described in other parts of this guide (Modify > Enter Group, or Modify > Exit Group), see also “Grouping Objects” in Chapter 5 (Combining Multiple Objects). As an example, we will produce a game piece.
Notice that combining 3D objects results in them being more or less “fused” together – there is no stacking or layering as with 2D objects. Adjust the position of the objects as you wish. You cannot arrange objects in front or behind others, as with 2D objects, but can only move them parallel to the drawing plane. Enter the group again and adjust the objects. The status bar indicates which object is marked.
3D objects of the Shape type can be rendered as wireframe models. This efect can be produced in other 3D objects by setting the Area fll to None and the line style to Continuous. If you select several 2D objects— without grouping them—and extrude the selection, they are transformed, according to their stacking order, with diferent extrusion depths. The object previously on top will be uppermost on the extruded object. For 2D objects use Modify > Shapes > Merge/Subtract/Intersect to produce complex objects.
8 Chapter Tips and Tricks
Positioning objects with zoom With zoom you can place objects with higher precision. Figure 166: Using zoom to place objects with greater precision Zoom adjustments using the status bar The current zoom value is shown at the right-hand end of the status bar next to the zoom slider. Figure 167: Zoom level on Status Bar You can adjust the zoom value by using the slider, right-click on the zoom percent to select from a menu of preset values, or double-click to open the Zoom & View Layout dialog.
• Fit width and height: The drawing page edges are set to the edges of the Draw page area. • Fit width: The right and left page edges are set to the vertical edges of the Draw page area. The exact efect of choosing one of these options depends on whether you have the Page pane switched on or of. Figure 169: Zoom values – Fit width and height, Fit width, and Optimal The Zoom toolbar The Zoom toolbar provides additional zoom options.
Resizes the display to include all objects on the slide. Zooms the selected object to Optimal. Enables moving the drawing inside the Draw window, using the mouse. Positioning objects with snap functions In Draw, objects can be accurately and consistently positioned using grid points, special snap points and lines, object frames, individual points on objects, or page edges. This function is known as Snap. To use the snap function easily, work with the highest practical zoom value.
Changing the color of the grid points By default the grid points are bright gray and not always easy to see. Go to Tools > Options > OpenOfce.org > Appearance. In the Drawing / Presentation section, you can change the color of the grid points. On the Color Settings pulldown menu select a more suitable/visible color, for example black. Figure 172: Changing the color of the grid points Confguring the grid Under Tools > Options > OpenOfce.org Draw > Grid you can change the settings of the grid (Figure 173).
Resolution: sets the horizontal and vertical distance between two grid points. Figure 174: Grids with diferent resolutions Subdivisions: determines how many steps there are between adjacent grid points. Intermediate steps make it possible to have a larger separation between two grid points, so the drawing remains clearer. Objects can snap to intermediate points in exactly the same way as to grid points.
Note In OOo the names of the buttons in the Options toolbar are Display Guides and Snap to Guides when what is actually meant is Display Snap line and Snap to Snap line. These will hopefully be corrected in a subsequent version. If you have activated this function, you can position objects exactly. Horizontal and vertical snap lines can be used together. Snap lines are not active immediately after inserting them but are turned on (or of) using the icon or with the View menu.
Inserting snap points and snap lines using coordinates The command Insert > Snap point / line opens a dialog where you can specify X and Y coordinates and choose the type of snap object: point, vertical line, or horizontal line. Figure 177: Setting a) snap object type and b) snap object position using X,Y coordinates Editing snap points and snap lines All snap objects can be edited after setting them.
Snap to object border With this function you can position one drawing object on the border of another. The connection point can lie anywhere on the object border. To use this function, frst deactivate Snap to grid. Figure 179 shows some examples. Note that a typical object border will touch the border of a round object at only one of its four points. Figure 179: Objects positioned on the border of another object Snap to object points This function operates in a similar manner to the one just described.
Help to position objects with guiding lines To simplify the positioning of objects it is possible to make visible guiding lines—extensions of the edges of the object—while it is being moved. These guiding lines have no snap function. The guiding lines can be (de-)activated under Tools > Options > OpenOfce.org Draw > View > Guides when moving, or by clicking the icon on the Options toolbar.
Note If you want to insert elements in a drawing from the Gallery or Clipboard, you should draw these to the same scale as you are using for the drawing to ensure the proper size ratio is maintained. Splitting drawings on multiple layers Layers are like transparencies that lie one on top of another on an overhead projector. You can insert and extract single layers as desired. For example in architecture the foor plan, heating, and electrical wiring can all be on separate layers.
On the Insert Layer dialog you can specify the following properties: • Visible: If this property is not activated, the layer will not be shown (the layer is removed from the stack). • Printable: If this property is not activated, the layer will not be printed. This is useful if you use a ‘draft’ layer for guides or annotations that you use in making the drawing but should not appear in the fnal output. • Locked: All objects on this layer are protected from deletion, editing, or moving.
Figure 183: Wall corner from two rectangles. From upper to lower: before merging, after merging and after hatching Figure 184 shows the fnished foor plan. In addition, a chest of drawers has been added. The body of the chest is drawn on the Layout layer; the pulled-out drawer and the open doors are drawn as a group and put on a separate user-defned layer (Layer4 in our example). Figure 185 shows how this is done.
Figure 185: Using layers for diferent parts of a drawing. (Left) Draw the body of the chest on the Layout layer. (Right) Create a new layer and draw the open drawers and doors, keeping the Layout layer visible to help you position the additional objects. Figure 186: Making layers visible or hidden. (Left) Hide the Layout layer to see what is on Layer4. (Right) Show the Layout layer and hide Layer4 to show chest with drawers closed.
Changing the layer of a drawing object Draw has no direct command to change layers. To move an object to another layer, change to the new layer, select the desired object or group, and then cut and paste it into position. Watch the status bar (the selected object’s layer name is shown in the information feld) to follow and check the change.
In the Pages area you can drag and drop a picture to change the order of pages in the document; a black horizontal line shows the position where the page will be inserted. Using the context menu you can insert or delete pages or duplicate pages with copy and paste (alternatively create duplicate pages using Insert > Duplicate Slide on the menu). Using page backgrounds With background pages you set common page settings for multiple pages of the Draw document.
Figure 187: Master View toolbar To return to normal mode, click the Close Master View button or View > Normal. You can edit background pages just like normal pages. With Format > Page > Background you can set the color, pattern, or background picture. These settings are specifc to each background page. In the Master view, you can set the size and orientation of the page; such settings apply to all pages.
Figure 188: Slide design dialog If the Exchange background page option is selected, the selected background page will be used on all pages of the document, not just on the currently active page. The Delete unused backgrounds option deletes any backgrounds (as shown in the Slide Design dialog) that have not been assigned to a page. Click the Load button to open the Load Slide Design dialog. From here you can load previously prepared background pages.
Color palette: adding or changing single colors Draw (like all OpenOfce.org components) uses color palettes for the representation of colors. In addition you can customize the color palette to suit your own needs and wishes. You can modify colors in a palette, add other colors, or create new color palettes. Reach these options with Tools > Options > OpenOfce.org > Colors or with Format > Area > Colors (tab) (see Figure 190).
Figure 190: The Colors tab in the Area dialog Click on the Edit button to open a dialog where you can set individual colors (see Figure 191). Many more input possibilities are available in this dialog. In the lower area you can enter values in the RGB and CMYK models as well as the HSB (Hue, Saturation and Brightness) model. The two color samples at the lower right show the current color (left) and the new color specifed by the color value felds (right).
of the color appears in the right of the two color felds (lower right in Figure 190; see also Method 2 below). If you click OK, the color window is closed and the input feld is again active. You can at this stage select the color you have just defned, give it a new name, and store it by clicking the Add button. The old color will then (without any further warning) be overwritten.
This latter can only be adjusted by entering a value into the number feld. Method 3 The left color window is divided like a chess board into 8 x 8 individual felds, each with a diferent color. Most important are the colors in each of the corner felds. The color red changes stepwise to green in the frst row, and stepwise to yellow in the frst column. The color green in the last column changes stepwise to blue.
Creating cool efects Duplication Duplication makes copies of an object while applying a set of changes (such as color or rotation) to the duplicates. Figure 193: Duplication example To start duplication, click on an object or group and choose Edit > Duplicate. The Duplicate dialog (Figure 194) appears. Figure 194: Duplicate dialog Choose the number of copies, their separation (placement), rotation, and so on. The choices above applied to a blue rectangle produce the result shown in Figure 193.
Cross-fading Cross-fading transforms one shape into another. The result is a new group of objects including the two end points and the intermediate steps. Figure 195: Cross-fading example To do a cross-fade, frst select two objects. Figure 196: The two objects selected for cross fading Then choose Edit > Cross-fading. Figure 197: Cross-fading dialog On the dialog choose the number of increments (transition steps). You probably want to have Cross-fade attributes and Same orientation both checked.
9 Chapter Organization Charts, Flow Diagrams, and More
Drawing an organization chart Even though Draw does not have an organization chart toolbar, you can draw these charts by drawing rectangles and connector lines (see Figure 198). You can indicate hierarchies by using a color progression from dark to light tones. Be sure your color choices maintain a good contrast between text color and background so that you can easily read the printed diagram.
You can also select one or more boxes and use Edit > Duplicate to make copies (see Figure 200). The spacing of the duplicated objects relative to the original can be controlled using the placement felds for the X and Y axes. Note that positive values for X and Y are to the right and downwards from the original object. Figure 200: Duplicating an object Which replication technique you use is up to you. The draft for the example in this chapter should look similar to that in Figure 201.
Set the text formatting and type the text. Depending on the length and format of the text, you may need to adjust the size of the box and the spacing to neighboring boxes or else change the formatting of the text to ft the box. Adjustments can be made initially with the mouse and then fne-tuned with the Position and Size dialog. Now set up the fll colors and save the drawing. The connections between the boxes are not drawn with ordinary lines but with Draw’s connectors.
Drawing a fow diagram For drawing fow diagrams (also known as fowcharts), Draw ofers a separate toolbar; click the fowchart icon toolbar. on the main Drawing Figure 203: The Flowchart toolbar The easiest way to draw a fowchart is to follow the same setup procedure as for organization charts. Select the symbols from the toolbar and drag them into position as described in Chapter 2 (Drawing Basic Shapes). See Figure 204 for an example of a typical fowchart.
Figure 204: Example of a fow diagram Glue points and connectors These elements were briefy introduced in Chapter 2 (Drawing Basic Shapes). This section describes how to use them. Connectors are lines or arrows whose ends automatically dock to a connection or glue point on an object. Connectors are particularly useful when drawing organization charts, fow diagrams, and mindmaps. The connecting lines between the symbols remain intact even when the latter are moved or rearranged. 176 OpenOfce.org 3.
The Connector toolbar Click the button on the Draw toolbar to open the Connectors toolbar (Figure 205). If the type of connector you want is not shown, click on the in the Connectors toolbar. In the list that appears, click on Visible buttons (Figure 206) to open a menu from which you can activate additional types of connector.
Connector types fall into four groups: • Standard connectors – the line segments run vertically and horizontally. All angles are right angles. The connector does not bend around the objects it binds. • Line connectors – consist of a line segment and two smaller horizontal or vertical segments at the ends. • Straight connectors – consist of a single line. • Curved connectors – are based on Bézier curves, as described in Chapter 10 (Advanced Draw Techniques).
Figure 208: Connector attached to the middle of an object As with all other objects, connectors have one or more control points to simplify the construction of the drawing. You can use these points to change the shape, length, and proportions of the connector line (see Figure 209). Figure 209: Control points of a connector To remove a connector from an object, either move the end of the connector away from the glue point of the object or simply delete the connector entirely.
Use this button to insert a new glue point. Draw a new object. If the object is flled, you can place a glue point anywhere inside the object or on its frame. With unflled objects you can place a glue point only on the outside frame but, after inserting it, you can then drag it inside the object. Activate the Glue Points icon on the Drawing toolbar. The glue points that you add remain visible as long as the Glue Points icon is active. They appear as small blue crosses.
If the Glue Point Relative button is active (as it is by default) the glue point will move when you change the size of the object, as shown below. If the Glue Point Relative button is deactivated, the remaining buttons on the toolbar, previously grayed out, become active. With these buttons you can decide how a glue point will be placed when the size of the object is changed. These buttons determine how the horizontal position of a glue point changes when you resize the object containing the glue point.
If you draw a connector and then click on it, only the end points and control points become active. In spite of this, a connector has its own object frame—in this case an invisible one. You can picture it easily by imagining a rectangle enclosing the start and end points of the connector (Figure 211). When you add text to a connector, the location of the text is referenced to this rectangle. The exact position of the text can be set in the Text dialog (Figure 212).
Take particular note of the Spacing to borders and Text anchor sections in the Text dialog. In the Text anchor section you can see the possible locations for the text. In the above example the text is anchored at the top left. In the Spacing to borders section at the lower left, negative values of spacing will position the text outside the frame. Adjusting text to suit the connecting line If you want the text to follow the slope or curve of a line, you need to activate and use the Fontwork tool.
Figure 214: Adding text to an inclined line, Step 2 The Fontwork dialog opens up many other possibilities to manipulate the text. You can, for example, turn the text around 180 degrees with the Orientation icon (which was done in the example above) or place the text under the line by assigning a negative value to the spacing between text and line. In addition, you can use the Fontwork dialog to generate curved text that follows the shape of a curved line.
10 Chapter Advanced Draw Techniques
Drawing to scale Draw is not a CAD (computer-aided design) program but a graphics program with which you can produce drawings to a scale. The example used for this chapter is a drawing of a Logic Circuit Diagram. The exact meaning of the individual symbols is not described here as we are only interested in the drawing techniques used to produce the diagram. The logic symbols in Figure 215 form the building block library for our scale drawing.
Figure 216: Positioning and dimensioning a Draw object Draw the frst connection lead by eye and dimension and position it using the Position and Size dialog. Figure 217: Setting the position and dimension of the upper input Use the same method to draw the remaining two leads. For positioning the input leads, fx the right end points; for the output lead, fx the left one. The frst wire lies 1.5 mm below the upper edge of the block. The leads have a 5 mm spacing between them.
The AND gate block is almost fnished. We can use it as the basis for all the other gates. So that the drawing gives a good visual impression, use Edit > Duplicate to ensure uniformity of shape and size. Because we want to copy the block vertically downwards, use a Placement on the X Axis of 0 mm and on the Y Axis 15 mm. Figure 218: Duplicating an object With the same method, copy both blocks twice more to the right.
Next add text to the symbols (&, =1 etc.). Activate the icon on the Options Toolbar. Double-clicking a symbol will now put you in a special text input mode. This integrates the text as an element in the object (see also Chapter 2 of this guide). You will fnd the OR symbol (≤) in the list of special characters (Insert > Special Characters). It is probably a good idea to create a group for each type of gate. This will make it easier to use them in a diagram.
Figure 220: The Glue Points toolbar Select the block on which you want to insert a glue point. Click the Insert Glue Point icon . It is now activated and appears with a diferent background. The mouse cursor changes to a small cross and you can set the frst glue point. Click the mouse at the desired location. If the point is not exactly where you want it, move it by dragging with the mouse.
the destination folder, then click on the frst symbol that you wish to add to the Gallery. Position the mouse cursor inside the selection frame of the symbol. When the crossed arrows are visible, click on the symbol and keep the mouse button pressed. After about 1 or 2 seconds the cursor will briefy blink and change to the drag symbol. Drag the object into the Gallery and release the mouse button. When you move the mouse into the Gallery feld, the cursor shape changes once more (see Figure 221).
Figure 222: Half adder drawn using logic symbol building blocks Begin with a new drawing. Set the unit of measurement to centimeter, a grid point spacing of 0.5 cm and subdivision of 4 points. Activate the grid, guiding lines, and associated snap functions. In the frst part of the exercise you should draw only the two signal leads a and b, the two INVERTER gates and the two AND gates. Begin by drawing the two signal leads. To make it a bit easier, you can use the values in the following table.
line from the context menu and set the guiding lines to 4.1 cm and 6.1 cm. In order that the blocks lie exactly underneath each other, insert vertical guiding lines at X=5.0 cm (INVERTER gate) and X=8.0 cm (AND gate). Now open the Gallery and drag the Inverter gate into approximately 0.64, the position desired. If the function Snap to guiding line is still active, you will be able to accurately position both blocks in the correct location. Your diagram should now look like Figure 223 and you can save it.
Figure 224: Drawing a half adder – Step 2 To position the two last gates, you need to set the following additional guiding lines: a vertical line with X=11 cm and two horizontal lines (C,D) at Y=5.5 cm and Y=7.5 cm respectively. Shift the horizontal lines C and D each 1.5mm upwards (so that Y=5.35 cm and Y=7.35 cm). Drag the OR and the last AND gate from the gallery and position them as in Figure 225.
with the mouse. The easiest way is to move the connection diagonally to the desired location (see Figure 227). The guiding lines are no longer needed and can be hidden (it is better to wait until you have fnished the drawing before you delete them). Your drawing should now start to look like Figure 226 and can be again saved. Figure 226: Drawing a half adder – Step 4 The individual blocks must now be joined up so that the gates function as a half adder system. To do this, you use connectors.
If you have correctly positioned the symbols in the drawing, all the connection leads will be straight lines. At this time you can delete all the guiding lines, add text to the drawing and your fnished drawing should resemble Figure 226 above. Dimensioning a drawing Confguring the dimensioning style As is usual with OOo, you confgure dimensioning using its own style. After opening a drawing, press F11 to access the Styles and Formatting window.
Figure 228: Confguring dimension lines Calculation of dimensions always takes into account the scale and 0.64 dimension units contained in Tools > Options > Draw > General. If you set a scale of 1:10 and a unit of centimeter, then a 6 cm long object in the drawing will be shown with a dimension of 60 cm when the option Show meas. unit is activated and the selection window is set to Automatic. Deselecting this option turns of the display of units.
Dimensioning objects In this exercise you will dimension some logic blocks (see Figure 229). They are used here to demonstrate the technique; you can use your own drawing or fetch a picture from the Gallery. Figure 229: Dimensioned logic blocks So that Draw can clearly recognize the edges to be measured, you should set a number of guide lines delineating the edges. The previous sections explain how to do this. To place the guide lines exactly and easily, change the resolution of the Grid.
After clicking the Dimension Line icon, the mouse cursor changes into a small cross. As we activated the option Dimension Line – Measure below Object, the dimensioning should be made in a counterclockwise direction. Place the mouse cursor at the left dimensioning point. Press the left mouse button and drag the mouse to the right dimensioning point. Release the mouse button.
Working with text in Draw You can use text in Draw in various ways: • as a text element • as text associated with a picture • as an element out of the Fontwork gallery • as a Writer OLE object Confguring text elements with styles Text, like all drawing objects, can be associated with styles. The text settings in styles always afect the whole text element. You can format individual parts of a text element, but only by using manual formatting, which does not relate at all to styles and templates.
Figure 232: Text tab of Graphic Styles dialog Anchoring text To try out the diferent settings possible for text anchors, start by drawing an ellipse from the Basic Shapes toolbar , change into Text edit mode by double-clicking on the ellipse and write several, not too long lines of text. Repeat with an ellipse from the Circles and Ovals toolbar (a classical drawing object). In the Text tab of the Edit Style dialog, set the values of the Spacing to Borders to 0 cm for all four directions.
Now we can try out some of the diferent possibilities of text anchoring. Text anchored to left middle – the text block is placed on the left side and centered vertically. Shapes Classical drawing objects “Left edge” here means the edge of the text frame whose left side fts totally within the fgure. “Left edge” here means the left side of the object frame – the frame with the green handles which is visible when you click on the object.
In the examples below, the frst line of text was shortened to “First line with”, spacings were set to 0 and text anchor to middle left. Shapes Classical drawing objects Without option “Full width” With option “Full width” Fitting text in frames Here you fnd that shapes and classic Draw objects behave completely diferently. For shapes the options on the right are active. Figure 233: Options active for shapes These have the following efects.
Resize shape to ft text: Watch out! If you turn on this option it is not possible to undo the size changes – neither using the Undo function on the menu nor by switching of the option in the dialog. For the classic drawing objects, both lower left options in the dialog are active. These options have the following efects. Fit to frame: The text is widened and compressed so that it flls out to the object frames. Adjust to contour: All the text is contained within the fgure.
Value for spacing “Above” -2 cm -1 cm 0 cm 1 cm 2 cm 3 cm The behavior is the same for classic drawing objects and shapes. If you anchor the text above, below, right or left, a positive spacing value positions the text in such a way that it sits close to the outside of the object frame at the anchoring point. Anchoring in the middle does not result in this movement. It is easier to add text to a straight line if the line is created as a very thin rectangle.
Figure 234: Legend with rounded corners Unlike drawing objects, text frames and callouts support automatic line breaks and you can switch on automatic hyphenation under Tools > Language > Hyphenation. Non-breaking dashes and protected separators are however not available. For a manual line break use, as elsewhere, the key combination Shift+Enter. With the text and callout icons ( and ) you can create text frames and callouts with vertical text.
All options of The text is broken at the object frame. You do not see text that does not ft within the object frame. It is still available and if you enlarge the object it will be visible. As with normal drawing objects the text positioning relates not to the fgure itself but to the object frame. Observe that the text frame in the example at left extends outside the ellipse.
Pictures and text Pictures also possess a text element. You can use this text element to place lettering over the picture or to give the picture a caption. To format this text, proceed in the same way as for a normal rectangle. Usually you produce text as a separate object and then group it with the picture, because this gives you more fexibility. Here are two examples showing what is technically possible with text elements.
Fontwork Gallery Click the icon to open the Fontwork Gallery (Figure 236) which you can use to insert an eye-catching caption to an image. Fontwork drawing objects belong to the shape category. The Gallery contains a selection of popular text forms. Figure 236: The Fontwork Gallery You are not limited to these samples; you can subsequently edit and customize the chosen caption type. Proceed as follows. Choose a caption type from the Gallery and click OK.
Double-click to enter text editing mode and replace the placeholder text “Fontwork” with your own text. Click outside the object or press the Esc key to leave editing mode. With the Area dialog from the Format menu or the context menu, you can set fll and shadow properties. Use the Line dialog to set a frame around the lettering. For further adjustments use the Fontwork toolbar. If this does not open automatically turn it on with View > Toolbars > Fontwork. The left symbol is already familiar.
To change the font type of the caption, use (as for other text) the dialog from the Format > Character menu or the context menu. If you want to give the text a 3D appearance, refer to the relevant section in Chapter 7 (Working with 3D Objects). Writer OLE object In some cases, text frames are not fexible enough to meet your needs and ofer too few possibilities for adjustment. For example, you may want to show a fgure in Draw in exactly the form it was created in Writer.
Editing mode As soon as you click on OK, the object is created and opens in editing mode. You can recognize this mode by the gray frame around the object and the small black handles. Take special note of the toolbars. These are no longer those of the Draw module but of the Writer module. You input your text and format it almost the same as if you were in Writer itself. In particular you now have available all the format styles from Writer.
Object mode Click on an object to enter object mode, recognizable by the presence of the green handles. In object mode you remain in the Draw module. Possibly you noticed that in edit mode there is no Zoom. Set the size of the OLE object on the Draw page in Object mode from the Position and Size dialog. In the left image of Figure 240 the object was inserted at the original size, at right the size was reduced.
click, which opens the text element in images, does not work here because it puts you into the OLE object’s edit mode. Whether it makes sense to use a text element within text like this is questionable! Guide to Bézier curves Bézier curves—what are they? OpenOfce.org uses cubic Bézier curves. A curve is defned by means of a start point P0, an end point P3, and two control points P1 und P2 (see the fgure at left). For points on the curve the terms nodes or anchors are often used.
Drag the mouse to approximately the position of your frst control point. It does not matter if this is not exactly right as you can move the control point location later. If you hold the Shift key down while dragging, the control point will lie on a 45 degree grid. Release the mouse button and move the mouse to the position of the end point of the curve. You can see that the line of the curve follows the movement of the mouse. Double-click at the end position.
You can switch on the option All control points in Bézier editor under Tools > Options > OpenOfce.orgDraw > View. The default is to see the control points and guide lines only when a point is marked by clicking the point. By holding the Shift key down as you mark, you can select and mark several points at the same time. A marked point is shown a little darker . Drawing a succession of Bézier curves Several lines or Bézier curves can be linked together. The single parts are referred to as segments.
Transition points For the transition from one segment to the next, there are three diferent types of points, each with its own properties. Corner points This is the only common point between two segments which are otherwise independent of each other. It is likely that the curve has a kink at this point (depending on the angle of the tangents, the lines from the corner point to each control point; see Figure 242).
Changing point types When a point is selected, the Edit Points toolbar activates the three corner point icons. The circled icons are, from left to right, Corner point, Smooth transition, and Symmetric transition. The latter two icons appear the same but you can identify them by looking at the tooltip. At any time only one of the three icons will be active. To change the type of point, click on one of the other two icons.
Transformation between straight line and Bézier curve Transform a straight segment into a Bézier curve Select the larger of the two handles at the ends of the straight line; this will be the starting point of the curve. After a short time the Convert to curve icon on the Edit Points toolbar becomes active. It starts in the “out” position. Click the icon to turn on the function. The straight line is transformed into a Bézier curve. The type of the segment end point remains as it was.
before after Freehand lines You can also produce a curved line from a Bézier curve using the freehand line tool . This tool automatically inserts anchor points and control points to render the curve as close as possible to the original Bézier curve. Place the mouse cursor at the beginning point and keep the mouse button pressed until you reach the end of the curve. As soon as you release the mouse button, the curve is complete.
Connecting curves To join curves together, select them and use Modify > Connect. A connection is only possible with open curves. If you use this tool on closed curves, they are frst opened and an additional end point inserted at the starting point. A straight line is used to connect the curves. The behavior of connected curves cannot (at present) be modifed. It is not obvious in advance how the transition properties of the connected curves are calculated, nor which end points will be connected.
You can move the small comment markers to anywhere you wish on the page. Typically you might place it on or near an object you refer to in the comment. To show or hide the comment markers, choose View > Comments. Select Tools > Options > User Data to confgure the name you want to appear in the Author feld of the comment, or to change it. If more than one person edits the document, each author is automatically allocated a diferent background color.
Index 3 B 3D bodies 117 creating by body rotation 118 creating by extrusion 117 extrusion 117 ready-made objects 119 rotating 121 segments 128 settings 123 3D efects geometry 125 illumination 134 material 140 shading 131 textures 137 3D efects dialog 123 3D scenes 119 combining objects 144 3D settings 123 3D settings for 3D shapes 3D color 143 depth 142 direction 142 illumination 143 surface 143 3D shapes extrusion 120 rotating 123 back, send object to 170 background pages 162 Basic Shapes toolbar 120 Bé
contoured image 109 rectangles 23 contrast 98 squares 24 controls layer 39 stars 31 conversion 90, 109 straight lines 21 convert polygon to curve 219 symbols 30 convert straight line to Bézier curve 219 drawing to scale 156 convert to a contoured image 109 Drawing toolbar 13 convert to bitmap 114 duplicate 169, 173 convert to polygon 110, 219 dynamic gradients 76 corner points 217 dynamic size modifcation 40 cropping 100 E cross-fading 170 Edit Points toolbar 49 curve toolbar 214 editing objects in a group
editing 179 Glue Points toolbar 189 inserting 180 setting 189 Gouraud shading 132 gradient fll 63, 66 gradients 76 graphic flter toolbar 101 graphics mode 98 grayscale 109 grayscale printing 114 grid 16 grid points 150, 151 grid settings 151, 158 grouping objects 79 guide distance 196 guide overhang 196 guides 16 guiding lines 156 H half adder 191 handles 36 hatching 64 hidden objects 38 horizontal distribution of objects 87 HSB color model 167 hyphenation 203, 206 I illumination color 141 illumination of
organization charts 172, 176 P page backgrounds 162 page margins 9 Pages area 161, 162 pasting from the clipboard 92 path 216 Phong shading 131 Picture (editing) toolbar 97 pictures and text 208 point reduction 111 point types, changing 218 polygon 109, 110 polylines 205, 222 pop-art flter 103 Position and Size dialog 186 positioning objects 84 posterize flter 103 Print options with raster graphics 114 projection 138 R raster graphics 90, 91, 137 reducing color depth 108 relief flter 104 remove noise 102
tolerance parameter 107 toolbars 12 basic shapes 30 block arrows 31 callouts 31 circles and ovals 26 connectors 28 curves 26 drawing 20 Edit Points 48, 49 fowcharts 31 lines and arrows 23 stars and banners 31 symbol shapes 30 text formatting 32 transition points 217 transparency 70, 76, 97, 99, 105, 146 Index U ungrouping 79 V vector graphics 7 vectorize 110, 113 vertical distribution of objects 88 vertical text 206 W wiring diagram 186 workplace 8 Writer OLE object 211 Z zoom 11 Zoom toolbar 149, 189