
Calc Guide
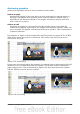

Aligning graphics
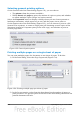
You can align several graphics relative to each other. To do this:
1) Select all of the graphics to be aligned (Shift+click on each in turn). The
graphics will be surrounded by an invisible bounding box with 8 green
handles.
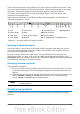
2) On the Picture toolbar, click on the Alignment icon and select one of the six
options.
Or, position the mouse pointer over any of the graphics. When the pointer
changes shape from an arrow to a hand, right-click and choose Alignment,
then select from the six options.
The six options include three for aligning the graphics horizontally (left, center, right)
and three for aligning the graphics vertically (top, center, bottom).
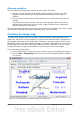
Creating an image map
An image map defines areas of an image (called hotspots) with hyperlinks to web
addresses, other files on the computer, or parts of the same document. Hotspots are
the graphic equivalent of text hyperlinks. Clicking on a hotspot causes Calc to open
the linked page in the appropriate program (for example, the default browser for an
HTML page; OOo Calc for a .ODS file; a PDF viewer for a PDF file). You can create
hotspots of various shapes, and include several hotspots in the same image.
To use the image map editor:
1) In your spreadsheet, select the picture where you want to define the hotspots.
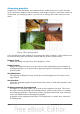
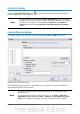
2) Choose Edit > ImageMap from the menu bar. The ImageMap Editor (Figure
121) opens.
Figure 121: The dialog to create or edit an image map
136 OpenOffice.org 3.3 Calc Guide