
Calc Guide
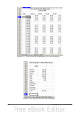
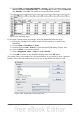
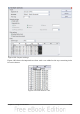

2) Choose Data > Group and Outline > Group . On the Grouping dialog, leave
Start and End as Automatically; in the Group by section, choose Intervals
and Months. Click OK. The result is now grouped into months.
Figure 182: Monthly sums
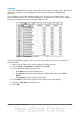
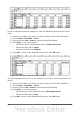
If you need a result with a percentage, start the DataPilot from this page.
1) Select the cell A3 (or any other single cell that contains a result of the
DataPilot).
2) Choose Data > DataPilot > Start.
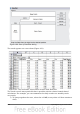
3) Double-click on Sum – hours to open the Data Field dialog (Figure 183).
4) Click on More, to see more options.
5) Switch Displayed value > Type to % of column.
6) Click OK to return to the DataPilot dialog, then click OK again.
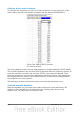
The result shows percentages as a decimal number. If you prefer to have a percent
format, select the cells and click on the % icon in the menu bar (Figure 184).
Figure 183: Properties of the data field
Chapter 8 Using the DataPilot 205