
Calc Guide

Note
This may be a very time-consuming process because of the large number
of items. The time does not depend that much on the number of lines but
rather on the number of rows needed for the table that contains the
results.
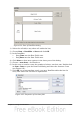
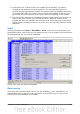
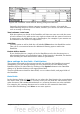
8) For grouping the rows, select the cell A4 or any other cell that contains a time.
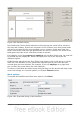
9) Choose Data > Group and Outline > Group, select for the interval Hours
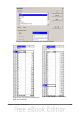
and click OK. The result is now grouped according to hours as shown in
Figure 195.
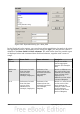
Figure 193: properties for grouping according to hours
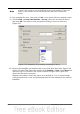
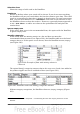
10) Restart the DataPilot and double-click on the Sum-Date data field. Figure 194
shows the Data Field dialog for the data field Number – Date. Click More and
select as type % of column. The result is shown in Figure 196. Figure 195
shows the absolute occurrence.
Whether the relative values are shown as a decimal (0.1) or as a percentage
(10%) depends only on the cell formatting itself and has nothing to do with the
DataPilot.
212 OpenOffice.org 3.3 Calc Guide