
Calc Guide


2) In the Sales list, instead of only one column for the amount, you made a
column for the amounts for each employee. The amounts then had to be
entered into the appropriate column. An analysis with the DataPilot would not
be possible any more. In contrast, one result of the DataPilot is that you can
get results for each employee if you have entered everything in one column.
3) You entered the amounts in chronological order. At the end of each month you
made a sum total. In this case, sorting the list for different criteria is not
possible because the DataPilot will treat the sum totals the same as any other
figure. Getting monthly results is one of the very fast and easy features of the
DataPilot.
Start
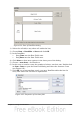
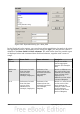
Start the DataPilot with Data > DataPilot > Start. If the list to be analyzed is in a
spreadsheet table, select only one cell within this list. Calc recognizes and selects the
list automatically for use with the DataPilot.
Figure 197: After starting the DataPilot
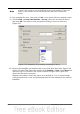
Data source
There are three possibile data sources for the DataPilot: a Calc spreadsheet, an
external data source that has to be registered in OpenOffice.org, or access to an
OLAP system (not available at this time).
Chapter 8 Using the DataPilot 215