
Calc Guide
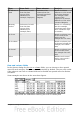
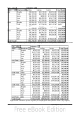
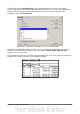
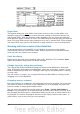
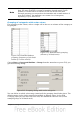
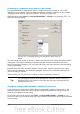
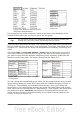
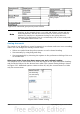
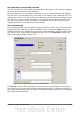
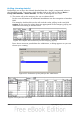

Figure 214: Database with nonscalar
categories (departments)
Figure 215: DataPilot
with nonscalar
categories
For grouping of non scalar categories, select in the result of the DataPilot all the
individual field values that you want to put in the one group.
Tip
You can select several non-contiguous cells in one step by pressing and
holding the Control key while left-clicking with the mouse.
Given the input data shown in Figure 214, execute the Data Pilot with Department in
the Row Field and Sum (Sick Days) in the Data Field. The output should look like that
in Figure 215. Select with the mouse the Departments Accounting, Purchasing and
Sales.
Choose the Data > Group and Outline > Group from the Menu bar or press F12.
The output should now look like that in Figure 216. Repeat this for all groups that
you want to create from the different categories (Select Assembly, Production and
Warehouse and Group again. The output should look like Figure 217.
Figure 216: Summary of single categories
in one group
Figure 217: Grouping finished
You can change the automatically given names for the groups and the newly created
group field by editing the name in the input field (for example changing 'Group2' to
'Technical'). The DataPilot will remember these settings, even if you change the
layout later on. For the following pictures, the dialog was called again (with a right-
click, Start) and by selecting the icon “Department 2”, then Options, and finally from
the preferences menu Automatic was selected. This generated the partial sum
results shown in Figure 218. Double-clicking Group 1 and Technical collapses the
entries, as shown in Figure 219.
Chapter 8 Using the DataPilot 227