
Calc Guide
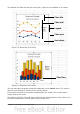

Data labels
Data labels put information about each data point on the chart. They can be very
useful for presenting detailed information, but you need to be careful to not create a
chart that is too cluttered to read.
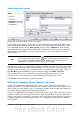
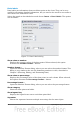
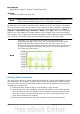
Select the graph as described above and choose Insert > Data Labels. The options
are as follows.
Figure 72: Data Labels dialog
Show value as number
Displays the numeric values of the data points. When selected, this option
activates the Number format... button.
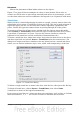
Number format...
Opens the Number Format dialog, where you can select the number format. This
dialog is very similar to the one for formatting numbers in cells, described in
Chapter 2 (Entering, Editing, and Formatting Data).
Show value as percentage
Displays the percentage value of the data points in each column. When selected,
this option activates the Percentage format... button.
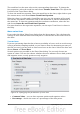
Percentage format...
Opens the Number Format dialog, where you can select the percentage format.
Show category
Shows the data point text labels.
Show legend key
Displays the legend icons next to each data point label.
Separator
Selects the separator between multiple text strings for the same object.
76 OpenOffice.org 3.3 Calc Guide