
Calc Guide

Note
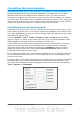
If your chart graphic is 3D, round red handles appear which control the
three-dimensional angle of the graphic. You cannot resize or reposition
the graphic while the round red handles are showing. With the round red
handles showing, Shift+Click to get the green resizing handles. You can
now resize and reposition your 3D chart graphic. See the following tip.
Tip
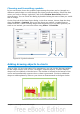
You can resize the chart graphic using its green resizing handles
(Shift+Click, then drag a corner handle to maintain the proportions).
However, you cannot resize the title or the key.
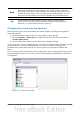
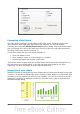
Changing the chart area background
The chart area is the area surrounding the chart graphic, including the (optional)
main title and key.
1) Double-click the chart so that it is enclosed by a gray border.
2) Choose Format > Chart Area or right-click on the chart area and choose
Format Chart Area.
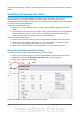
3) On the Chart Area dialog, choose the desired format settings.
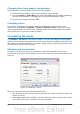
On the Area tab, you can change the color, or choose a hatch pattern, bitmap or some
preset gradients. Click on the drop-down box to see the options. Patterns are
probably more useful than color if you have to print out your chart in black and
white.
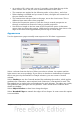
You can also use the Transparency tab to change the area’s transparency. If you used
a preset gradient from the Area tab, you can see the different parameters of which it
is composed.
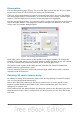
Figure 75: Chart Area dialog
Chapter 3 Creating Charts and Graphs 81