OpenOffice.org 3 Draw Guide Drawing Vector Graphics in OpenOffice.
Copyright This document is Copyright © 2005–2011 by its contributors as listed below. You may distribute it and/or modify it under the terms of either the GNU General Public License (http://www.gnu.org/licenses/gpl.html), version 3 or later, or the Creative Commons Attribution License (http://creativecommons.org/licenses/by/3.0/), version 3.0 or later. All trademarks in this guide belong to their legitimate owners.
Contents Copyright.......................................................................................................................2 Chapter 1 Introducing Draw............................................................................................................7 Introduction...................................................................................................................8 The Draw workplace..........................................................................................
Introduction: grouping and combining objects.........................................................79 Grouping objects.........................................................................................................79 Combining objects......................................................................................................80 Merging, subtracting, or intersecting shapes...........................................................81 Aids for positioning objects............................
Adding comments to a drawing................................................................................202 Connecting and breaking lines.................................................................................203 Index..............................................................................................................................204 OpenOffice.org 3.
Note for Mac users Some keystrokes and menu items are different on a Mac from those used in Windows and Linux. The table below gives some common substitutions for the instructions in this chapter. For a more detailed list, see the application Help. 6 Windows/Linux Mac equivalent Effect Tools > Options menu selection OpenOffice.
1 Chapter Introducing Draw
Introduction Draw is a vector graphics drawing tool, although it can also perform some operations on raster graphics (pixels). Using Draw, you can quickly create a wide variety of graphical images. Vector graphics store and display a picture as simple geometric elements such as lines, circles, and polygons rather than as a collection of pixels (points on the screen). This permits simpler storage and supports precise scaling of the picture elements. Draw is fully integrated into the OpenOffice.
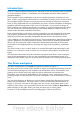
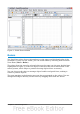
Figure 1: Initial Draw window Rulers You should see rulers (bars with numbers) on the upper and left-hand sides of the workspace. If they are not visible, you can enable them by selecting them from the View menu (View > Ruler). The rulers show the size of a selected object on the page (see the gray double lines, highlighted in Figure 2). When no object is selected, they show the location of the mouse pointer, which helps to position drawing objects more accurately.
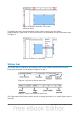
Figure 2: Rulers show the size of the selected object To modify the units of measurement of the rulers (which you can define independently), right-click on the desired ruler, as illustrated for the horizontal ruler in Figure 3. Figure 3: Rulers in a drawing Status bar The Status bar is located at the bottom of the Draw window and includes several Draw-specific fields, as identified in Figures 4 and 5.
The Position field shows different information, depending on whether objects are currently selected or not: • When no object is selected, the left number pair shows the current position (in X,Y Cartesian coordinates) of the mouse cursor. • While an object is being resized with the mouse, the right number pair shows the size of the object (width and height). Note The sizes are given in the current measurement unit (not to be confused with the ruler units).
choose Visible Buttons from the drop-down menu. Visible icons are indicated by an outline around the icon. Click on icons to hide or show them on the toolbar. Figure 6: Selection of visible toolbar icons The tools available in the various toolbars are explained in the following sections. Standard toolbar The Standard toolbar is the same for all OpenOffice.org components and is not described in detail here.
Text Formatting toolbar When text is selected, the Line and Filling toolbar changes to the Text Formatting toolbar, which is very similar to the Formatting toolbar in Writer. A more detailed explanation of the buttons on this toolbar can be found in Chapter 4 (Changing Object Attributes). Figure 10: Text Formatting toolbar Color bar To display the Color bar, use View > Toolbars > Color Bar. The toolbar then appears at the bottom of the workspace and displays the current color palette.
Figure 12. Changing the color palette Options toolbar The Options toolbar lets you activate or deactivate various drawing aids. The Options Bar is not one of the toolbars displayed by default. To display it, select View > Toolbars > Options. Figure 13: Options toolbar The options are described in the table below and in greater detail in other chapters of the Draw Guide.
Icon Function Snap to grid Snap to guides Snap to page margins Snap to object borders Snap to object points Allow quick editing Select text area only Double-click to edit text Simple handles Large handles Modify object with attributes Exit all groups Drawing grid and guides Draw offers a grid as a drawing aid. The grid can be turned on or off by clicking on the Grid icon on the Options toolbar. The points of the grid displayed on the screen are not shown on the printed drawing.
You can “tear off” this tool set so it becomes a floating toolbar. Click the area at the bottom of the toolset, drag it across the screen to a location you want, and then release the mouse button. To dock a floating toolbar to the top or side of the Draw workspace, Ctrl+click on the title of the toolbar. To float a docked toolbar, click on its handle and drag it off the side of the workspace (see Figure 15). The floating-toolbar capability is common to all components of OpenOffice.org.
Customizing toolbars You can customize toolbars in several ways. To show or hide icons defined for a toolbar, see Figure 6 on page 12. To add functions to a toolbar, move tools between toolbars, or create new toolbars., choose View > Toolbars > Customize, select the Toolbars tab (Figure 16) and the toolbar you want to change, and then select the desired buttons for that toolbar. Figure 16: Customizing a toolbar Each toolbar has a different list of functions.
Controlling printing For more control over printing, use the Print dialog (File > Print or Ctrl+P). Figure 17. The Print dialog The options selected on the Print dialog apply to this printing of this document only. Note To specify default printing settings for OpenOffice.org, go to Tools > Options > OpenOffice.org – Print and Tools > Options > OpenOffice.org Draw – Print. The Print dialog has four tabs, from which you can choose a range of options, as described in the following sections.
Figure 18: General print options Printing multiple pages on a single sheet of paper You can print multiple pages of a document on one sheet of paper. To do this: 1) In the Print dialog, select the Page Layout tab. 2) In the Layout section, select from the drop-down list the number of pages to print per sheet. The preview panel on the left of the Print dialog shows how the printed document will look.
To print an individual page: 1) Choose File > Print from the menu bar. 2) Select the page to print. a) In the Ranges and copies section of the Print dialog, select the Pages option. b) Enter the number of the page to print. 3) Click the Print button. To print a range of pages: 1) Choose File > Print from the menu bar. 2) Select the pages to print. a) In the Ranges and copies section of the Print dialog, select the Pages option.
5) Select the Brochure option. 6) In the Page sides section, select Back sides / left pages option from the Include drop-down list. 7) Click the Print button. 8) Take the printed pages out of the printer, turn the pages over, and put them back into the printer in the correct orientation to print on the blank side. You may need to experiment a bit to find out what the correct arrangement is for your printer.
To change the OpenOffice.org settings to print all color text and graphics as grayscale: 1) Choose Tools > Options > OpenOffice.org > Print. 2) Select the Convert colors to grayscale option. Click OK to save the change. 3) Open the Print dialog (File > Print). 4) Click the Print button to print the document. To change the Draw settings to print all color text as black, and all graphics as grayscale: 1) Choose Tools > Options > OpenOffice.org Draw > Print.
To export to one of these formats, choose File > Export. On the Export dialog, specify a file name for the exported document, then select the required format in the File format list and click the Export button. See Chapter 6 (Editing Pictures) for more about exporting graphics. Note The content of the exported file will depend on the element(s) selected on the page. No selection results in the entire image being exported. For most export formats only the image on the current page will be exported.
2 Chapter Drawing Basic Shapes
Creating simple drawings You can create 2D and 3D objects in Draw. This chapter shows how to draw simple 2D objects. The following chapters describe how to work with and edit such objects. All shapes, whether they are lines, rectangles, or more complicated shapes, are called objects. This is common notation in vector drawing software. The drawing tools are found on the Drawing toolbar. Figures 19 and 32 show parts of the standard form of the toolbar, as installed with Draw.
Drawing a straight line We begin with the drawing of the simplest element—a straight line. Click on the Line icon on the Drawing toolbar and place the mouse pointer at the point where you want to start the line (see Figure 20). Drag the mouse while keeping the mouse button pressed. Release the mouse button at the point where you want to end the line. A blue selection handle appears at each end of the line, showing that this is the currently selected object.
Figure 21: The information area in the status bar Drawing an arrow Arrows are drawn like lines. Draw classifies arrows as a subgroup of lines: lines with arrowheads. The information field on the status bar shows them only as lines. Click on the Line Ends with Arrow icon to draw an arrow.
5 6 7 8 1 2 3 4 9 1 Line 2 Line Ends with Arrow 3 Line with arrow/circle 4 Line with arrow/square Figure 22: Arrows toolbar 10 5 Line (45°) 6 Line starts with arrow 7 Line with circle/arrow 8 Line with square/arrow 9 Dimension line 10 Line with arrows Drawing a rectangle or square Drawing a rectangle is similar to drawing a straight line, except that you click on the Rectangle icon on the Drawing toolbar, and the (imaginary) line drawn by the mouse corresponds to a diagonal of the rectangle.
Drawing ellipses (ovals) and circles To draw an ellipse (also called an oval) or a circle, click on the Ellipse icon on the main Drawing toolbar. (A circle is simply an ellipse with both axes the same length.) The ellipse drawn is the largest ellipse that fits within the (imaginary) rectangle drawn by the mouse (Figure 24). Figure 24: Drawing an ellipse There are three ways to draw an ellipse or a circle: • Holding down the Shift key while dragging with the mouse draws a circle.
Figure 25: Adding the extended Ellipse toolbar 4) On the Customize dialog, ensure that the checkbox by the new Ellipse command is selected, and then use the up and down arrow buttons to move it to the desired position on the toolbar. 5) To remove the simple Ellipse icon from the Drawing toolbar, click to highlight it in the Customize dialog, and press the Delete key (or click the Modify button and choose Delete from the drop-down menu). 6) Click OK to complete the process.
Drawing elliptical and circular arcs To draw an arc, choose the appropriate Arc symbol in the Circles and Ovals toolbar. Drag with the mouse to create a guide circle or ellipse. Release the mouse button and move the cursor to the position where you want the arc to start. In the status bar, you can measure the actual angle in degrees. Single-click this point; the circle (or ellipse) disappears and moving the mouse creates the arc. Again, the status bar shows the current angle.
• Freeform Line: With this tool you can draw just like with a pencil. Press and hold the left mouse button and drag the mouse. It is not necessary to end the drawing with a double-click. Just release the mouse button and the drawing is completed. If you have selected Freeform Line, Filled, the end point is joined automatically to the start point and the object is filled with the appropriate color.
Figure 30: A connector between two objects Draw offers a range of different connectors and connector functions. Open the floating Connectors toolbar by clicking on the arrow next to the Connector icon (Figure 31).
Note If you select shapes for editing, the information field in the toolbar shows the type of shape selected and, if more than one object is selected, the total number. Figure 32 shows part of the Drawing toolbar with the icons referred to in the following sections. Clicking on the arrow next to the icon opens a floating toolbar with the relevant work tools.
Flowcharts The tools for drawing flowcharts are accessed by clicking on the Flowcharts icon . The creation of flowcharts, organization charts, and similar planning tools are described in Chapter 9 (Organization Charts, Flow Diagrams, and More). Callouts Use the Callouts icon toolbar. , to open the Callouts Stars and banners These tools are associated with the Stars icon . You can add text to all these shapes. See “Using text elements in Draw objects” on page 37.
Language Settings > Languages). If you still do not see the Vertical Text icon, enable it on the Drawing toolbar by clicking the arrow on the right hand side of the toolbar, select Visible Buttons, and click on Vertical Text to make this icon show on the toolbar. Text frames can be moved and rotated like all draw objects. For more details on text input, see Chapter 10 (Advanced Draw Techniques). After activating Text command mode, click at the location where you want to position the text.
width (Figure 36). You can, however,—just as when editing any other text—insert your own line breaks, begin new paragraphs, or change any of the text properties. Text input in a fixed frame – the text wraps automatically Figure 36: Text frame Using text elements in Draw objects A text element is associated with most Draw objects. By means of these elements, text can be added to an object (see Figure 37).
3 Chapter Working with Objects and Object Points
Introduction This chapter looks at the tools and functions that let you modify existing drawings. All of the functions apply to a selected object or group of objects, which can be distinguished by small colored squares or circles located around it. These points are called handles. The handles form a rectangular frame that is just big enough to contain the object. Where several objects are selected, the frame around them corresponds to the smallest rectangle that can contain all of the objects.
Selections for rotating objects are indicated by small red circles and a symbol representing the center of rotation. To choose these selections, click on the Effects drop-down button from the Drawing toolbar and after that on the object. Changing the selection mode To go from one mode to another, you can do one of the following: • Choose the Points button from the Drawing toolbar to switch from simple selection mode to Points mode. You can also use the keyboard shortcut F8 (Points).
click. The number and type of the selected objects is shown at the left of the status bar to help you to select the correct object. Note This method generally works in Windows, but on a Linux system it usually does not. If the Alt key on your system does not operate as described above, use the Tab key method described below. To select an object that is covered by another object using the keyboard, use the Tab key to cycle through the objects, stopping at the object you wish to select.
Figure 39: Left end of status bar during dynamic adjustment For example, when you are resizing an object, the object information fields show which object is selected, the current position in X/Y coordinates, and object dimensions (width x height). The information changes as the mouse is moved. The units of measurement are those selected under Tools > Options > OpenOffice.org Draw > General.
Caution This is the default behavior of the Shift key. However, if you have used Tools > Options > OpenOffice.org Draw > Grid to set Snap position to When creating or moving objects, the action of the Shift key is the opposite: the aspect ratio will be preserved unless the Shift key is pressed. Dynamic size modification of objects with the help of the status bar If you select an object and modify it using the mouse, the changes are immediately reflected in the information field of the status bar.
Figure 41: Editing an arc If you click and hold the mouse button when the hand cursor appears, moving the mouse will change the location of the start or end point of the arc. The actual coordinates are shown in the Status Bar (see lower left graphic in Figure 40. Rotating and shearing an object using the mouse Use the red rotation handles to either rotate an object around an axis or slant or shear the object.
Changing inclination or perspective To slant or shear objects, use the red handles located at the midpoint of an edge of the selected objects. The mouse pointer changes to a over one of these midpoint handles. Note when the pointer hovers In current versions of Draw, basic shapes can be sheared and slanted. The effect however will probably be different to that obtained when a classic object has the same slant or shear applied to it, particularly when the mouse is used to create the effect.
Setting size and position exactly You can position and resize objects with the mouse, but this method is not very exact. If you need accurate positioning of objects, use Format > Position and Size from the menu bar, or right-click the object and select Position and Size from the context menu, or press F4. Position and Size Open the Position and Size dialog (see Figure 45) and click on the first tab to set the appropriate values.
Rotating objects Click on the Rotation tab of the Position and Size dialog (see Figure 46). Here you can define the rotation angle, as well as the location of the pivot point. Figure 46: Rotating an object Slant and corner radius The slant angle (inclination or shearing) and corner radius can be set in this dialog (Figure 47).
You can use this dialog to round the corners of the usual Draw objects—text boxes, legends, rectangles, and squares, as shown in Figure 48. The same effect can be achieved when you are in the points mode (click the Points icon on the Drawing toolbar), by dragging the large handle with the mouse. The larger the value for the corner radius, the rounder the object becomes. Slant You can shear both the older, classic Draw objects and the newer Shape objects. Enter the slant angle in the box marked Slant Angle.
The mouse pointer changes shape when hovered over a yellow handle. If you drag one of these handles, you can modify the shape of the object; the type of change is dependent on the shape itself. For example, you can round the corners of a rectangle or square, change the angles of an arc or ellipse, or alter the control points of a circular or elliptical segment. How curves work The editing of curves depends on the mathematics of Bézier curves1.
1 2 3 4 Points Move Points Insert Points Delete Points 5 6 7 8 Split Curve Convert to Curve Corner Point Smooth Transition 9 Symmetric Transition 10 Close Bézier 11 Eliminate Points Figure 52: Edit Points toolbar The three kinds of tangent Three buttons in the Edit Points Toolbar let you select the type of tangent and convert from one type to another. Only one of these buttons can be active at any given time. Their use is described in the following chapter.
The Move Points button is the default mode when editing points. If it has not been activated, click on its button. When this mode is active, the mouse pointer has the following shape when it is hovered over an edit point: Figure 56: Moving a junction point Movement of a point is one of the easiest manipulations to do. Figure 56 illustrates how you can draw an egg very easily by starting from a circle and dragging the top point upwards.
➊ The Delete Points button has the opposite effect: it subtracts one or more points from the curve. The resulting curve stretches itself automatically around the remaining points after subtraction. Select one or more points to delete. You can select several points by holding down the Shift key (➊). When you have selected the points you want to delete, click the Delete Points button.
To close an existing curve, select an open curve and click on the Close Bézier button . The opening point is identified by a slightly larger handle (Figure 62). Figure 62: Closing an open curve 1. Select object and set Edit points mode The Eliminate Points button with lines with multiple points. button only functions If the button is active, click on a point, hold the mouse button down and move the mouse to draw virtual straight lines between the neighboring left and right points.
The Rotate function from the Effects drop-down button on the Drawing toolbar and the Rotation Mode after Clicking Object button on the Options toolbar can be used in Edit Point mode. In this case, it can be used to move single points around the contour of an object. Switch into rotation mode by clicking on either of the rotation buttons. Notice that in rotation mode, all of the tangent points become red dots.
4 Chapter Changing Object Attributes
Toolbars and menus To change an object’s attributes (such as color or border width) you can use the Line and Filling toolbar or the context menu. Line and Filling toolbar If the Line and Filling toolbar is not visible, you can display it using View > Toolbars > Line and Filling. From here you can edit the most common object attributes. You can also open the Line dialog by clicking on the Line icon and the Area dialog by clicking on the Area icon to see more options.
Figure 67: Right-click on an object to see the context menu Editing lines and borders Lines, arrows, and the borders of an object are managed through the same dialog (Figure 69). Figure 68: Lines and borders You can change some properties from the Line and Filling toolbar. To see more options, select the object and right-click on the object and choose Line from the context menu. This opens the Line dialog.
Figure 69: Line dialog (right-click on an object and choose Line). Common line properties In most cases the property you want to change is the line’s style (solid, dashed, invisible, and so on), its color, or its width. These options are all available from the Line and Filling toolbar. Figure 70: Common line options (style, width, color) You can also edit these properties from the Line dialog. They are on the first tab, left column (see Figure 69).
Drawing arrows Arrowheads (and other line endings—usually referred to in this guide collectively as arrows) are a line property. Select a line and click on the Arrow Style This opens the Arrowheads menu. icon. Figure 72: Arrowheads menu There are several types of arrowheads available. Each end of the line can have a different arrowhead (or no arrowhead). Note Arrowheads are only applicable to lines. They have no effect on the border of an object.
Line shadows Lines can have a shadow property associated with them. Figure 74: Shadow page of Line dialog Check the box Use shadow to enable this feature. The properties shown—position, distance, color, and transparency—may be independently adjusted to your choice and the results seen in the preview window. You can also click on the Filling icon on the Line and Filling toolbar—next to the area fill functions – to get a basic shadow.
Figure 75: Editing line styles Customizing arrow styles You can also create your own arrowheads to provide some interesting effects, such as: The first step is to draw a curve with the shape you want for the arrowhead. Figure 76: To create your own arrowhead, you must first draw a curve. Note The arrowhead must be a curve. A curve is something you could draw without lifting a pencil. For example, is a curve but is not a curve.
Tip The part of the shape which should point in the direction of the line must be drawn facing upwards. In Figure 76 the top of the shape will point towards the “outside” of the line. Figure 77: Adding an arrow style Now you can access the new style from the Arrow style list (Figure 78) or the Arrowheads dialog (Figure 72). Figure 78: Arrow style list 62 OpenOffice.org 3.
Editing the inside (fill) of an object The OpenOffice.org term for the inside of an object is Area fill. The area fill of an object can be a uniform color, a gradient, a hatching pattern, or an image. It can be made partly or wholly transparent and can throw a shadow. Figure 79: Different types of area fill Common fill properties In most cases, you will choose one of the standard fill options, whether it is a color, a gradient or an image. These options are all available from the Line and Filling toolbar.
Fill with a gradient Select the object you wish to edit. On the Line and Filling toolbar, select Gradient and then choose a gradient from the right-hand menu. Figure 82: Filling with a gradient Fill with a line pattern The OOo term for line patterns is Hatching. Select the object you wish to edit. On the Line and Filling toolbar, select Hatching and then choose an option from the menu.
Figure 84: Filling with an image Adding a shadow to an area Click on the Filling icon on the Line and Filling toolbar—next to the area fill functions (Figure 85). Figure 85: Adding a shadow Advanced area fill options Click on the Area icon to bring up the Area dialog. From this dialog, you can fine tune the area fill of an object in greater detail. Creating your own fill color Click on the Colors tab of the Area dialog (Figure 86). From here you can modify existing colors or create your own.
Figure 86: Customizing the color palette Creating your own gradient On the Area dialog, click on the Gradients tab. From here you can modify existing gradients or create your own. Figure 87: Customizing gradients A gradient works by creating a smooth transition from one color to another. First, you need to choose two colors (Figure 88). 66 OpenOffice.org 3.
Figure 88: Choosing colors for a gradient Then choose a type of gradient. There are several available (Linear, Axial, Radial, and so on) and each has up to four different options to specify it in detail. For example, a radial gradient has a center you can specify (Figure 89). Figure 89: Center option in a radial gradient Figure 90 shows how an ellipsoid gradient is rotated, moved vertically and horizontally, and the color of the border area varied.
You can customize options like the spacing between lines, the angle and the color of the lines. There is no way to edit the line thickness. Figure 91: Modifying hatchings Creating your own bitmap fill You can add your own bitmap images to fill an area. First, you need to create the bitmap image. This could be a photo or another sketch you have created in another program. For example, you can draw something with Draw and export it as a PNG format image file.
From there you can add new bitmap images to serve as area fills. Click on Import and choose a file you previously saved. Give it a name that will make it easy to remember. The last imported image will appear at the bottom of the pull-down list of bitmap fills. Now you can use that image as an area fill. Figure 93: Adding your own bitmap images Tip If the imported image seems to be very small in the preview (Figure 92) you probably forgot to select the image before you exported it.
Shadows can also have transparency, so the shadow does not hide objects behind it. Figure 95: Shadow with 50% transparency Adding transparency You can make objects partly or fully transparent, or even a with a varying degree of transparency (as a gradient). On the Transparency page (Figure 96), choose Transparency (for a uniform transparency) or Gradient for a gradient transparency. Figure 96: Transparency page of Area dialog An example of gradient transparency is shown in Figure 97.
Using styles Suppose that you want to apply the same area fill, line thickness, and border to a set of objects. This repetitive process can be greatly simplified by the use of styles. Styles allow you to define a formatting template (a style) and then to apply that style to multiple objects. For more about styles, see Chapter 6 (Introduction to Styles) in the Writer Guide.
Modifying a style Modifying a style is similar to creating a new style. Select an object with that style and change the area and line properties. When satisfied, click on the Update Style icon . Alternatively click the Styles and Formatting icon or press F11, right-click the style you wish to modify and select Modify. Edit the properties you want to change and click OK to finish. Special effects First make sure that the Drawing toolbar is selected (View > Toolbars > Drawing).
Flip an object Select an object and click on the Flip icon . You will see a dashed line through the middle of the object. This dashed line is the axis of symmetry. The object will be reflected about this line. Move one or both ends of the line with your mouse to set the orientation of the axis. Then, grab any one of the eight green handles and move it across to the other side of the dashed line. The new position of the figure is shown faintly until the mouse is released.
Distorting an image There are three tools on the Effects menu that let you drag the corners and edges of an object to distort the image. The Distort tool distorts an object in perspective, the Set to Circle (slant) and Set in Circle (perspective) tools both create a pseudo three-dimensional effect. The results of using these tools are shown in the following figures. Distort an object Select an object and click on the Distort icon . Draw will ask if you want to transform the object to a curve.
Figure 102: Set an image in a circle with perspective Set to circle (slant) Select an object and click on the Set to Circle (slant) icon. Draw will ask if you want to transform the object to a curve. This is a necessary step before distortion, so click Yes. Then you can move the object handles to give a pseudo three-dimensional slant perspective.
Dynamic gradients You can control transparency gradients in the same manner as color gradients. Both types of gradient can be used together. With a transparency gradient, the direction and degree of an object’s fill color changes from opaque to transparent (in a regular gradient, the fill changes from one color to another, but the degree of transparency remains the same). If you have assigned transparency to an object with a color fill, you can control the transparency by clicking on the Transparency icon .
A single color object and a transparency gradient, covering part of the underlying object. The gradient can be dynamically adjusted, made more transparent by moving the white square or more opaque by moving the black square. An object with a color gradient, completely covering another object. The gradient is adjusted dynamically by moving the squares – the color of the square relating to the increase or decrease in that color.
5 Chapter Combining Multiple Objects
Introduction: grouping and combining objects Using Draw, you can combine drawing objects together in two distinct ways: grouping and combining. These two methods allow you to treat multiple objects as one unit, or to merge objects to form a new shape. Grouping is like putting objects in a container. You can move them as a group and apply global changes to them. A group can always be undone and the objects that make up the group can always be manipulated separately.
Editing individual objects in a group You can edit a member of a group individually without breaking the group. To do this, right-click and choose Enter group or double-click on the group. Figure 106: When you enter a group, objects outside the group cannot be selected and appear pale Once inside the group, click on any object to edit it. Figure 107: Editing an object inside a group To leave this mode, right-click and choose Exit group or double-click outside the group.
At first glance, the appearance of the combined objects can seem rather surprising. However, once you understand the rules governing combination in Draw, it will become clearer. • The attributes (for example, area fill) of the resulting object are those of the object furthest back. In this example, it is the circle. • Where the objects overlap, the overlapping zone is either filled or empty depending on the number of overlaps.
Merge When you merge objects, the new object covers the entire surface of the original objects (it is the union of the objects). In the same way as combining, the fill of the merged object is determined by the fill of the object furthest in the background. Other properties are not taken over into the new object. Subtract When you subtract, the front object is subtracted from the object behind it. Intersect When you intersect two objects, you get only the area covered by both objects.
4) Draw a small ellipse covering just the lower right corner and subtract again. 5) The knife blade is now complete. To make the handle, draw a rectangle and an ellipse as shown. 6) Merge the shapes together. 7) Group this image with the previous one. Aids for positioning objects Draw has various tools to help you arrange the objects with respect to each other. Here we explore some of the more important ones.
1 2 3 4 Bring to Front Bring Forward Send Backward Send to Back 5 In Front of Object 6 Behind Object 7 Reverse Figure 111: The floating Position toolbar brings the selected object to the front of the group. brings the selected object one step forwards. sends the selected object one step backwards. sends the selected object to the back of the group. moves the selected object in front of another chosen object. moves the selected object behind another chosen object.
into a hand and the outline of the second object becomes a dashed line (see below). Clicking on this object completes the rearrangement of position. reverses the order of the selected objects (this option is grayed out if only one object is selected). Aligning objects Select two objects and long-click on on the Drawing toolbar to open the Align toolbar. This toolbar can be torn off and made to float. The tools help you position objects with respect to each other.
Align right. Align top. Center vertically. Align bottom. If you have selected only one object, clicking the various buttons on the Align toolbar positions the object in relation to the drawing page. Distributing the distance and space between objects Select at least three objects. Now you are able to select the option Distribution on the Modify menu or from the right-click menu. The Distribution dialog contains a number of options, described below.
Horizontal distribution None. Does not distribute the objects horizontally. Left. The left edges of the objects are evenly spaced from one another. Center. The horizontal centers of the objects are evenly spaced from one another. Spacing. The horizontal spacing between the objects is evenly distributed. Right. The right edges of the objects are evenly spaced from one another. Vertical distribution None. Does not distribute the objects vertically. Top.
6 Chapter Editing Pictures (Raster Graphics)
Introduction Earlier chapters of the Draw Guide have dealt only with vector graphics. However, Draw also contains a number of functions for handling raster graphics (bitmaps) such as photographs and scanned pictures, including import, export, and conversion from one format to another. Draw can read all the usual graphics file formats. It has a subset of the same capabilities as specialized raster graphics programs like Adobe Photoshop or The Gimp.
To link or to embed? If you select the Link option in the Insert picture dialog, the graphic is linked rather than embedded. It is not actually inserted into the document; instead, a link to the graphic is created. This link is relative to the folder where the document is stored, even though it shows up in the Edit Links dialog (see Figure 117) as an absolute link.
To insert an image from the scanner: 1) Prepare the image in the scanner and make sure that the scanner is ready. 2) Choose Insert > Picture > Scan > Request. 3) The rest of the procedure depends on the scanner driver and interface. You will normally be required to specify the resolution, a scan window, and other options. Consult the scanner’s documentation for more information. 4) When the image is scanned, Draw places it on the page. At this point it can be edited like any other image.
Figure 118: Inserting complete pages or objects on a page Choose the slides or objects you want to insert; for multiple selections, press the Control or Shift key while clicking on the items. Click OK to insert the selected items. If the inserted object was named in the source document, it keeps its original name unless the name already exists in the current document. In that case you must give the object a new name before it is inserted.
To export a multi-page Draw document as a series of web pages, choose File > Export and select HTML Document as the file type. The HTML Export wizard opens. Follow the prompts to create the web pages. If you wish, the wizard can generate a navigation aid to help in moving from page to page. If you want to use the objects in other applications, select one of the Metafile formats (JPEG, PNG, TIFF, BMP and so on) in the lower part of the File format list (see Figure 120).
Figure 121: Adjusting format specific properties prior to export The actual number of pixels used is determined by the screen resolution set up by the operating system and the Drawing scale factor set in Tools > Options > OpenOffice.org Draw > General. This is a limitation of the current user interface; it is possible to set other resolutions using macros.
Modifying raster object properties As with other objects, the properties of a raster graphic can be modified. You can format the graphic using the Format menu or the context menu. Use the Picture toolbar to add or change filters using the Graphic Filter Bar; adjust the Lines, Areas and Shadows properties. The Transparency property in the Format menu does not relate to the transparency of the raster graphic itself but to the background area.
Color Use the Color tool to adjust the values of the three RGB colors, the brightness, contrast and the Gamma value. These adjustments do not affect the original picture but the values are stored in Draw as a separate formatting set. You can select values from between –100% (no color) to +100% (full intensity); 0% represents the original value of the property. The brightness can be adjusted between –100% (totally black) and +100% (totally white).
Figure 123: Interactive crop marks on an image Cropping Figure 124: The Crop dialog More control and accuracy over cropping functions are available via the Format menu. Click Format > Crop Picture and the dialog box in Figure 124 will appear. The fields Left, Right, Top, and Bottom establish the amount to be trimmed off the appropriate edge. In addition to cropping, you can also enlarge or reduce the size of the graphic by changing the percentage scaling values.
• If you choose Keep Scale, the graphic will be cropped to the scales shown in the width and height boxes and the picture reduced in size accordingly. • If you choose Keep image size, the graphic will be cropped and then enlarged to the original image size. Take care with these operations: in the Crop dialog the width and height are treated as totally independent values. Changing one without the other can result in significant distortion of the image; this might not be what you want.
Sharpen increases the contrast between neighboring pixels, emphasizing the brightness difference. This will accentuate the outlines. The effect will be strengthened if you apply the filter several times in a row. Remove noise compares every pixel with its neighbors and replaces the extreme values (those that deviate in color by a large amount from a mean value) by a pixel with a mean color value.
Aging lends pictures a certain “look” resembling that of old photos. The process first produces a grayscale picture from the original and then reduces the intensity of the blue and green color values, so that the final picture appears darker and redder. In the middle example, the aging degree was set to 0%, on the right it was 15%. Posterize reduces the number of colors in the picture. The fewer colors, the more flat the picture appears.
The Relief filter calculates the edges in relief of the picture and produces a picture as if illuminated by a light source, the position of the illuminating light being variable and producing shadows that differ in direction and magnitude. Mosaic takes groups of pixels and converts them into a single color rectangular tile. The whole picture appears to be a mosaic. The center and right pictures below had an element resolution of 5 pixels.
Practical example: Changing wrong colors to transparency Some applications, which cannot correctly handle transparency, show transparent areas with the color Magenta and then store the graphic with this color and without the correct transparency information. Bitmap graphic with area in magenta, which actually should be shown transparent. On the left is the original picture, right is the picture after saving it with MS Paint.
The selection list for replacement colors shows all the available colors in the current color palette of the document. You cannot define any new colors here but you can add colors to the available palette before using the eyedropper tool. For more on this topic, see Chapter 8 (Tips and Tricks). Effect of the tolerance parameter The tolerance parameter describes how closely a color value in the picture must agree with the source color in order to be replaced.
1 bit dithered The impression of grayscale is produced by a raster. In reality there are only two colors. 1 bit threshold The threshold determines which pixels are black and which are white. You cannot set it directly but you can influence which part of the image is set to black by varying color settings on the picture toolbar—red, green, blue level, brightness, contrast, and/or gamma value—to see what works best for your image.
8 bit grayscale palette Conversion Convert to a contoured image Select the picture so you see the green handles. From the context menu or from the Modify menu choose Convert > to Contour. This command creates from the original image a polygon or group of polygons, with four corner points and the image set as a background graphic. In this state you are not able to further edit the graphic. All your modifications must be completed before this point.
The Convert to Polygon dialog has a number of settings which can be tested using the Preview button. Because graphics conversion can take some time, depending on the picture and the computer, a progress bar is included at the bottom of the dialog. Number of colors Draw considers between 8 and 32 colors in the conversion. The picture can, however, contain fewer colors than 8. For every color occurring in the picture, Draw creates a polygon, which may consist of several disconnected parts.
Original picture transformed with the Poster filter and 64 colors … … and then with 16 colors and 0 pixel point reduction vectorized. Here the picture is transformed with the Poster filter, but this time with a point reduction of 4 pixels and a tile size of 16 pixels.
Using the graphic generated in the posterize and vectorize process above, Break and Split it, and then try out some operations using the tools on the Effects toolbar. To use this tool to vectorize the first letter of a chapter in a special font, convert the graphic to a polygon, using no point reduction or background tiling. Use Modify > Break to generate two polygons. An example is shown below. Original polygon, converted from a Metafile. Break the graphic into two polygons.
Convert to bitmap All drawing objects are vector graphics. Use the command Convert > To Bitmap from the context menu to convert a vector graphic to a raster graphic. Draw creates the raster graphic in PNG format with a color depth of 24 bits. Unfortunately any transparency effects which were created in the vector graphic are lost in this conversion, although the PNG format used in Draw does support transparency. Only if you use the eyedropper tool to set transparency will an Alpha channel also be produced.
Figure 127: Options - OpenOffice.org - Print dialog 110 OpenOffice.org 3.
7 Chapter Working with 3D Objects
Creating 3D objects Although Draw does not match the functionality of leading drawing or picture editing programs, it is capable of producing and editing very good 3D drawings and pictures. Draw offers two different types of 3D objects: 3D bodies and 3D shapes. Depending on which type you choose, there are different possibilities for further editing of the object (rotation, illumination, perspective).
Figure 129: Rotation body created using variation 2.1 Method 2. Click the icon on the Effects pull-down menu on the Drawing toolbar. This icon can also be accessed from the Mode menu, accessible from View > Toolbars > Mode. Notice that this icon lacks the curved red arrow of the fixed-axis rotation icon. With this method, you can change the location of the rotation axis, which appears as a dotted line with two white circular endpoints. Figure 130: Rotation body created using variation 2.
After choosing the type of object, left-click on the starting point and drag the mouse diagonally until the outline of the object is the size you want. After releasing the mouse button, the 3D object appears. To change the height:width ratio of the object, keep the Shift key pressed while dragging the mouse. Most of these objects are constructed by rotation. Cubes and spheres are special types of 3D objects that are directly defined in the OOo program code.
If you click on such an object, the 3D-Settings toolbar is available. If this is not automatically opened, switch it on with View > Toolbars > 3D-Settings. Figure 134: 3D-Settings toolbar The first icon corresponds to the icon on the Drawing toolbar. This icon also works as a toggle switch. After changing to 2D, the 3D-Settings toolbar is again hidden. To change the object back to 3D, you must use the icon toolbar.
Editing 3D objects Rotating 3D objects Procedure for 3D bodies The Rotation command used for 2D objects also works with 3D objects, but due to the additional axis, there are a few differences with the editing of 3D objects (see Figure 136). The procedure for selecting the object is identical to that used for a 2D object. Figure 136: 3D object rotation You can rotate the object about each axis (X,Y,Z).
Procedure for 3D shapes Objects produced using variations 4 and 5 (see above) can only be rotated about the Z axis when using the three methods described in the previous section. This rotation is carried out on the underlying 2D object. It is also possible to rotate the 3D object in the same way as with a 2D object using Format > Position and Size > Rotation (shortcut key for Position and Size is F4) and specifying the pivot point location and the number of degrees of rotation desired.
In order for the Effects dialog to take over all the current properties of the object, you must click the button. If you deactivate this button before you leave an object and click on it again when you open the Effects dialog for another object, the settings are carried over from the first object to the second object. You can use this to transfer favorite settings from one object to another, as all the settings are brought over to the new object. In normal use, however, the icon should be left activated.
3D Effects - Geometry On the Geometry page, you can make changes to the geometry of a 3D object. This page is opened with the Geometry button dialog. in the upper part of the 3D Effects Figure 141: Geometry page In the first example, the depth (length) of a body is to be changed. This is possible only if you created it through extrusion. To illustrate: draw a circle and convert it according to Variation 1 into a 3D object (a flat cylinder); see Figure 142 a and b.
3D Effects dialog to change the rounding to 30%. The cylinder should now resemble that in Figure 143. Figure 143: Edge rounding of 10% (a) and 30% (b) This parameter also has interesting effects when you convert text into a 3D object. The Scaled Depth parameter sets the size ratio of the front to the back for a 3D object produced by extrusion.
The Rotation Angle parameter is only available for rotation bodies. With this parameter you can create a segment of a complete rotation body by choosing an angle less than 360 degrees. Figure 146 shows a hemisphere with a rotation angle of 270°. Figure 146: Hemisphere with a rotation angle of 270° The Horizontal and Vertical Segments parameters define the number of segments out of which Draw builds spheres and rotation objects2. For rotation objects, the horizontal segments are more important.
Figure 148: Left: without “Double-Sided” Middle: with continuous lines but without “Double-Sided” Right: with “Double-Sided” Use the buttons in the section Normals to modify the normals of a 3D object. A Normal is a straight line which is perpendicular to the surface of an object (in the same way that a vector, starting from an inner point and extending outwards, is at right angles to the surface of the object at the point where it exits).
Spherical: The enclosing sphere is calculated for the object and then projected onto the object. This form of calculation produces an object with a smoother surface; the edges of individual segments are more smoothly rounded than with the Object-specific effect (see Figure 150). However surfaces that meet at a point do not show a realistic lighting effect. Invert Normals: This results in a reversal of the lighting direction. The inside of the body then becomes the outside.
• Flat is the fastest and simplest method. For every individual segment a special color tone is determined, based on the lighting ratio and the direction of the segment area. This tone is used for the whole area of the segment. The segmentation is clearly visible. • Phong is the most time-consuming method. With this method, for each pixel the associated normal is determined by interpolation, based on the normals of the segment edges.
All three methods function at the pixel level, and therefore shadowing and mirroring inside the 3D scene (as permitted by ray tracing methods) are not possible.. With the the Shadow button you can provide a 3D object with a shadow. By changing the Surface angle you can influence the form of the shadow (see Figure 153). The left sphere has a surface angle of 0° (the paper represents a perpendicular surface behind the object) while the right sphere has a surface angle of 45°.
Picture a shows a 3D object with the standard settings. The individual changes are listed in the following table. Distance: Focal length: a b c d 0.81 cm 3.81 cm 0.81 cm 0.81 cm 10 cm 10 cm 5 cm 15 cm 3D Effects - Illumination On the Illumination page (see Figure 155) you define how a 3D object is lit. The settings apply to all objects in a scene. Figure 155: Illumination (lighting) page You can light a scene with a maximum of eight individual Light sources at the same time.
Figure 156: Adjustment of light source In the selection list next to the symbols you can choose the color of the active light source. If desired, click the button to open a color palette dialog, where you can define your own color and also adjust the brightness. For the first light source, it is best to retain the neutral color value (default is white); with several light sources it is advisable to reduce the brightness.
Figure 158: Lighting with three independent light sources In Figure 158 the ring has the lighting settings from Figure 155 with the standard color white. In addition it was lit with magenta, and also from the left underside with yellow. The number and position of the light sources is shown in the window at the lower right. The three light sources in use can be recognized by the “lit” symbols . To see the effect of a particular lighting effect you can also temporarily turn it off.
Figure 159: Textures page In the first row of the page (Figure 159) are two Type switches allowing you to choose between black and white or color for the texture (see Figure 160). Figure 160: a - standard color setting, b - texture (color), c - texture (black and white) With the two switches in the row Mode you can control whether the texture of the selected objects is rendered with light and shadows (Switch 2) or not (Switch 1); see Figure 161.
Figure 161: Texture without (a) and with (b) lighting and shadow effects Projection X / Y With one of these three buttons you can determine how the texture for this coordinate axis should be projected onto the object. The default setting, Object specific, usually gives the best result. Examples of the use of each button are shown below. Object specific The texture is automatically adjusted for a best fit with the form and size of the object.
Projection X OpenOffice.org Projection X Projection X Area fill without tiling, with adjustments Projection Y Projection Y (Difference is small) Upper and under sides Figure 163: Cylinder as an extrusion object The Filter button switches on and off a soft-focus filter. It can often remove slight faults and errors in the texture. 3D Effects - Material On this page you can assign the appearance of different materials to the 3D object.
Figure 165: The favorites (from left to right): Metal, Gold, Chrome, Plastic and Wood With the individual color parameters, additional effects can be produced. The meaning of these parameters corresponds to those on the Illumination dialog page. Materials and textures can be combined with one another. Settings only simulate materials and it is sometimes a matter of trial and error to achieve the desired result. Tip Do not use too high a brightness value for individual colors.
Figure 166: 3D-Settings toolbar, indicating icons for formatting 3D shapes If you have used it in error, you can remove the incorrect formatting with Format > Default Formatting. With the buttons on this toolbar you can adjust the extrusion depth and perspective, lighting and material properties as well as the extrusion color. There are tear-off bars, which you open by clicking on the small black triangle. The purpose of each individual button is described by its tool tip.
Illumination The light color cannot be changed, the brightness can be changed only in three levels, and some effects may not be rendered with total correctness. left: from left under, dim middle: from left under, bright right: from right under, normal Surface Only four built-in variations are possible. At present only Wireframe and Matt are correctly rendered.
First produce both objects independently of each other. The subsequent combination is made easier if you use parallel projection and rotate the objects into an upright, straight position. Click on the sphere and use Edit > Copy to take over the scene and put the sphere on the clipboard. If you are sure that you do not need the original anymore you can use Edit > Cut. In any case move the sphere a little to the side. Click now on the cone. The status bar will show 3D Scene selected.
Enter the group again and adjust the objects. The status bar indicates which object is marked. Use the Tab key to change from one object to the next in the group, if it is not possible to do so with the mouse. Exit the group. Now you can rotate the entire 3D scene and view your game piece from all sides. Examples for your own experiments All examples use objects in 3D scenes.
If you select several 2D objects—without grouping them—and extrude the selection, they are transformed, according to their stacking order, with different extrusion depths. The object previously on top will be uppermost on the extruded object. For 2D objects use Modify > Shapes > Merge/Subtract/Intersect to produce complex objects. The resulting figures can be also extruded, rotated and so on. Rotation of lines produces concave bodies. Use a bright line color.
8 Chapter Tips and Tricks
Positioning objects with zoom With zoom you can place objects with greater precision. Figure 167: Using zoom to place objects with greater precision Zoom adjustments using the status bar The current zoom value is shown at the right-hand end of the status bar next to the zoom slider. Figure 168: Zoom level on Status Bar You can adjust the zoom value by using the slider, right-click on the zoom percent to select from a menu of preset values, or double-click to open the Zoom & View Layout dialog.
The exact effect of choosing one of these options depends on whether you have the Page pane switched on or off. Figure 170: Zoom values – Fit width and height, Fit width, and Optimal The Zoom toolbar The Zoom toolbar provides additional zoom options. On the Standard toolbar (View > Toolbars > Standard), click on the downwards arrow of the Zoom button . You can also permanently display the toolbar by clicking on View > Toolbars > Zoom. Figure 171: Zoom Toolbar Zoom in. Enlarges the monitor picture.
line and to the page edge. It is best, however, to activate only those functions that you really need. Examples for setting up the snap functions are found in Chapter 10 (Advanced Draw Techniques). Snap to grid Use this function to move an object exactly to a grid point. This function can be switched on and off with View > Grid > Snap to Grid and on the Options toolbar with the icon .
There is no need to use the Grid section, as these settings can be changed directly from the icons on the Options toolbar. Figure 174: Configuring the grid Resolution: sets the horizontal and vertical distance between two grid points. Figure 175: Grids with different resolutions Subdivisions: determines how many steps there are between adjacent grid points. Intermediate steps make it possible to have a larger separation between two grid points, so the drawing remains clearer.
Draw looks in the vicinity of the object for these special help elements to determine the final position of the object; with the snap range setting, you can determine the extent of this search area. Exactly how large the snap area is depends on the current environment: which particular snap functions are in use, how the grid is configured, and whether or not there may be collisions with other objects. It is usually necessary to do a little experimenting to find what best suits your needs.
Inserting snap points and snap lines using coordinates The command Insert > Snap point / line opens a dialog where you can specify X and Y coordinates and choose the type of snap object: point, vertical line, or horizontal line. You can also access this menu by right-clicking in the draw area and selecting Insert Snap Point/Line. Figure 178: Setting a) snap object type and b) snap object position using X,Y coordinates Editing snap points and snap lines All snap objects can be edited after setting them.
Snap to object border With this function you can position one drawing object on the border of another. The connection point can lie anywhere on the object border. To use this function, first deactivate Snap to grid. Figure 180 shows some examples. Note that a typical object border will touch the border of a round object at only one of its four points. Figure 180: Objects positioned on the border of another object Snap to object points This function operates in a similar manner to the one just described.
The guide lines can be (de-)activated under Tools > Options > OpenOffice.org Draw > View > Guides when moving, or by clicking the toolbar. icon on the Options Figure 182: Working with guiding lines Drawing to scale In Draw a drawing is made on a predefined drawing area or canvas. This will usually be in the Letter or A4 format depending on your locale settings, and will be output to some “standard” printer that you have set up on your computer (usually referred to as the default printer).
In Draw three layers are always present by default: Layout, Controls, and Dimension Lines. Layout is the default layer when you create a new drawing. To change to a layer, click on its tab. Everything that is drawn will be placed on the currently selected layer. The Controls layer is for control elements such as icons and pull-down menus and is not usually used for ordinary drawing elements.
Tip You can move objects on one layer while you are working on another layer. To avoid doing this accidentally, you should lock layers that you are not currently working on. An example drawing: house plan and furniture A popular application for programs like Draw is the “moving the furniture” scenario. You can easily draw the floor plan of a room or a house using Draw. The simplest way is to draw walls as thick lines.
Figure 185: Floorplan with chest of drawers Figure 186: Using layers for different parts of a drawing. (Left) Draw the body of the chest on the Layout layer. (Right) Create a new layer and draw the open drawers and doors, keeping the Layout layer visible to help you position the additional objects.
Figure 187: Making layers visible or hidden. (Left) Hide the Layout layer to see what is on Layer4. (Right) Show the Layout layer and hide Layer4 to show chest with drawers closed. Caution If you copy a drawing object to the Clipboard or into the Gallery, all layers other than the three standard layers (Layout, Controls and Dimension Lines) are lost. Furthermore all objects are pasted into the Layout layer.
Using the Pages area By default the Pages area is docked on the left of the Draw window. It shows every page in the document as a small picture. Select a picture from the Pages area and the corresponding page is loaded in the main workspace. Click on the page to activate it for editing. The Pages area behaves similarly to the Styles and Formatting area. Drag on the gray separator line to change the width of the Pages pane. Click on the middle of this line to show or hide the pane.
Note The terms used in this area may not be completely consistent, so that the terms Slide/Page and Master/Background/Page Template are used more or less interchangeably in places. When looking for information in Help, it may be necessary to use alternative search terms. Creating a page background Change with View > Master to the Master view and note that a related Master View toolbar opens. If this toolbar does not appear, activate it with View > Toolbars.
Figure 189: Slide design dialog If the Exchange background page option is selected, the selected background page will be used on all pages of the document, not just on the currently active page. The Delete unused backgrounds option deletes any backgrounds (as shown in the Slide Design dialog) that have not been assigned to a page. Click the Load button to open the Load Slide Design dialog. From here you can load previously prepared background pages.
Reach these options with Tools > Options > OpenOffice.org > Colors or with Format > Area > Colors (tab) (see Figure 191). The latter method allows color palettes to be loaded or to be stored for future use. Any modifications made to colors apply only to the currently active palette. OpenOffice.org always uses the RGB color model internally. Other methods are also available for the definition of a color value. The color values can be input directly as numbers.
Click on the Edit button to open a dialog where you can set individual colors (see Figure 192). Many more input possibilities are available in this dialog. In the lower area you can enter values in the RGB and CMYK models as well as the HSB (Hue, Saturation and Brightness) model. The two color samples at the lower right show the current color (left) and the new color specified by the color value fields (right).
defined. The number for the hue represents the angle in the color wheel; the other two are both percentage values. Method 2 You can select a new color by clicking on a point in the color window at the upper right of the dialog. The chosen color is shown in a black frame which can be dragged with the mouse. If this color is not quite right, you can fine tune it as described above in Method 1 by changing the color values. As you drag the small square you will see the value change in the number fields.
Figure 193: Changing the color of a corner square Creating cool effects Duplication Duplication makes copies of an object while applying a set of changes (such as color or rotation) to the duplicates. To start duplication, click on an object or group and choose Edit > Duplicate. The Duplicate dialog (Figure 195) appears. Figure 194: Duplication example Figure 195: Duplicate dialog Choose the number of copies, their separation (placement), rotation, and so on.
Cross-fading Cross-fading transforms one shape into another. The result is a new group of objects including the two end points and the intermediate steps. Figure 196: Cross-fading example To do a cross-fade, first select two objects. Figure 197: The two objects selected for cross fading Then choose Edit > Cross-fading. Figure 198: Cross-fading dialog On the dialog choose the number of increments (transition steps). You probably want to have Cross-fade attributes and Same orientation both checked.
9 Chapter Organization Charts, Flow Diagrams, and More
Drawing an organization chart Even though Draw does not have an organization chart toolbar, you can draw these charts by drawing rectangles and connector lines (see Figure 199). You can indicate hierarchies by using a color progression from dark to light tones. Your color choices should maintain a good contrast between text color and background so that you can easily read the printed diagram.
Figure 201: Duplicating an object Which replication technique you use is up to you. The draft for the example in this chapter should look similar to that in Figure 202. Figure 202: The finished draft The next step is to add text to the boxes. It is easiest to insert it as a text element within the box as described in Chapter 2 (Drawing Basic Shapes). Activate the icon on the Options toolbar and then double-click the box to enter text into it. Alternatively, select the box and press F2.
You can use dynamic text frames instead of boxes. These have the advantage of automatic line breaks. Figure 203 shows the sequence of text input into a frame, adding borders, and setting the background color. The Line and Filling toolbar may not be visible until you have set a line type for the frame. Set the line type using Format > Line or right-clicking the text frame and selecting Line.
Figure 204: The Flowchart toolbar Figure 205: Example of a flow diagram Chapter 9 Organization Charts, Flow Diagrams, and More 163
Select the shapes that are to lie in a vertical straight line and center them with Modify > Alignment > Centered. For those on a horizontal line, select the shapes and center them with Modify > Alignment > Center. You can also set snap lines if you need several vertical lines. After adding text and setting the fill color, you can join individual symbols together and add text to the connectors. This technique is described in the next section.
Connector types fall into four groups: • Standard connectors – the line segments run vertically and horizontally. All angles are right angles. The connector does not bend around the objects it binds. • Line connectors – consist of a line segment and two smaller horizontal or vertical segments at the ends. • Straight connectors – consist of a single line. • Curved connectors – are based on Bézier curves, as described in Chapter 10 (Advanced Draw Techniques).
As with all other objects, connectors have one or more control points to simplify the construction of the drawing. You can use these points to change the shape, length, and proportions of the connector line (see Figure 209). Figure 209: Control points of a connector To remove a connector from an object, either move the end of the connector away from the glue point of the object or simply delete the connector entirely. Editing glue points Glue points can be edited using a separate toolbar (see Figure 210).
In the left-hand drawing below is a glue point in the circle with a left entry and one in the square with a right entry. The effect of this when adding a connector between the two glue points is shown in the right-hand drawing.. If you are in glue point editing mode and you add another direction to a glue point (for example by activating the button), Draw tries to optimize the length of the connector. For the example above, the connection inside the circle would change as shown below.
These buttons determine in a similar manner the vertical position of a glue point when the size of the object is changed. Adding text to connectors To add text to a connector, double-click the connector. The end and control points become active and the familiar flashing text cursor appears (the cursor position is determined by the most recent setting). The Text Formatting toolbar also appears (under the menu bar). Use this toolbar to set the text properties; you can directly insert the text.
Figure 212: The Text dialog Adjusting text to suit the connecting line If you want the text to follow the slope or curve of a line, you need to activate and use the Fontwork tool. To add this tool to the Draw toolbar: 1) Choose Tools > Customize from the menu bar. 2) On the Toolbars tab, select Drawing from the Toolbars pull-down list. In the Toolbar content section, click Add. 3) On the Add Commands dialog, select Format from the left-hand list and the command Fontwork.
Figure 213: Adding text to an inclined line, Step 1 Figure 214: Adding text to an inclined line, Step 2 The Fontwork dialog provides many other possibilities for manipulating text. You can, for example, rotate the text 180 degrees with the Orientation icon (which was done in the example above) or place the text under the line by assigning a negative value to the spacing between text and line. In addition, you can use the Fontwork dialog to generate curved text that follows the shape of a curved line.
10 Chapter Advanced Draw Techniques
Drawing to scale Draw is not a CAD (computer-aided design) program but a graphics program with which you can produce drawings to scale. The example used for this chapter is a drawing of a Logic Circuit Diagram. The exact meaning of the individual symbols is not described here as we are only interested in the drawing techniques used to produce the diagram. The logic symbols in Figure 215 form the building block library for our scale drawing.
Draw the first connection lead by eye and dimension and position it using the Position and Size dialog. Figure 217: Setting the position and dimension of the upper input Use the same method to draw the remaining two leads. For positioning the input leads, fix the right end points; for the output lead, fix the left one. The first wire lies 1.5 mm below the upper edge of the block. The leads have a 5 mm spacing between them.
Using the same method, copy both blocks twice more to the right. Select both blocks, call up the Duplicate dialog, and use placement values of 30 mm (X) and 0 mm (Y). Your drawing should look similar to Figure 219. Figure 219: The blocks after duplication For the INVERTER or NOT gate the connection leads must be amended. Move one input and one output lead to the middle of the block and delete the superfluous input lead.
The best solution is to use the Zoom toolbar to enlarge the diagrams. You can find this as a tear-off toolbar on the standard Drawing toolbar. It contains (among others) tools for zooming in and out (enlarging or shrinking the view) of the current page. If you click on the Zoom In tool and then click on the page, the scale is doubled and the view is centered on the place where you clicked.
inside the selection frame of the symbol. When the crossed arrows are visible, click on the symbol and keep the mouse button pressed. After about 1 or 2 seconds the cursor will briefly blink and change to the drag symbol. Drag the object into the Gallery and release the mouse button. When you move the mouse into the Gallery field, the cursor shape changes once more (see Figure 221).
Figure 222: Half adder drawn using logic symbol building blocks Position two horizontal guiding lines (A, B) on the grid with Y=4.0 cm and Y=6.0 cm. With Snap to Grid active, this should be no problem. With an INVERTER gate the input and output leads lie in the middle of the block, 4 mm below the upper edge. In order that the input and output are docked to the guiding line, the upper edges of the INVERTER gate must be positioned (for a 5 mm grid spacing) at Y=4.1 cm and Y=6.1 cm.
The input and output leads of the INVERTER lie at Y=4.5 cm and Y=6.5 cm. Move the mouse over a guiding line. When the mouse cursor changes to a double arrow, drag the guiding line (with the left mouse button pressed) onto the input and output leads of the block. If the grid snap is still active, this should be exactly positioned without much effort. The leads of the AND gate lie 1.5 mm below the upper edges of the two horizontal guiding lines. They must be moved up for the next step.
Since the OR gate will be connected to the two previously positioned AND gates, you can delete the guiding line of the OR gate. Drag the 0.64 horizontal guiding lines C and D over the inputs of the AND gates (Y=7.0 and 7.5 cm) and put two other lines (E,F) on the remaining connections (Y=5.0 and 8.0 cm) as shown in Figure 226. Deactivate all snap functions except Snap to grid. It is a good idea to zoom in so that you can place the lead connections exactly over the intersection points.
If you have correctly positioned the symbols in the drawing, all the connection leads will be straight lines. At this time you can delete all the guiding lines, add text to the drawing and your finished drawing should resemble Figure 222 on page 177. Dimensioning a drawing Configuring the dimensioning style As is usual with Draw, you configure dimensioning using a style. After opening a drawing, press F11 to access the Styles and Formatting window.
In the right section you can change the settings for the Legend, the text of the dimension line. You can use the Text position choices to change the location of the text – but only if one or both of the AutoVertical and AutoHorizontal checkboxes are unchecked. Use the various options on the Text and Alignment tabs to further change the text format. Calculation of dimensions always takes into account the scale and dimension units contained in Tools > Options > Draw > General.
Start the dimensioning command by clicking the Dimension Line icon on the Arrows toolbar. This toolbar is not visible by default. The dimension line is placed automatically on the Dimension Lines layer so that you can hide dimension lines if you wish. Figure 230: a) Delimiting the edges with guide lines b) Dragging the dimension line (anticlockwise) c) Finished dimension line After clicking the Dimension Line icon, the mouse cursor changes into a small cross.
All the changes that you make relate only to the selected dimension line. They are stored and persistent, but do not affect the settings of the Dimension Line style. If you insert other dimension lines, they will have the settings contained in the style. If you want to make general setting changes to the Dimension Lines style, change the appropriate style. As soon as you confirm the changes with OK, the new settings will be applied to all dimension lines.
Figure 232: Text tab of Graphic Styles dialog Anchoring text To try out the different settings possible for text anchors, start by drawing an ellipse from the Drawing or Basic Shapes toolbars , change into Text edit mode by double-clicking on the ellipse and write several (not too long) lines of text. Repeat with an ellipse from the Circles and Ovals toolbar (a classical drawing object). This toolbar is not available by default; you must customize the Drawing toolbar to add it.
Now we can try out some of the different possibilities of text anchoring. Text anchored to left middle – the text block is placed on the left side and centered vertically. Shapes Classical drawing objects “Left edge” here means the edge of the text frame whose left side fits totally within the figure. “Left edge” here means the left side of the object frame – the frame with the green handles which is visible when you click on the object.
Shapes Classical drawing objects Without option “Full width” With option “Full width” Fitting text in frames Here you find that shapes and classic Draw objects behave completely differently. For shapes the options on the right are active. Figure 233: Options active for shapes These have the following effects. Word wrap text in shape: No automatic hyphenation is available and you cannot insert a fixed hyphen. If the text does not fit within the shape, the overflow appears above or below the shape.
For the classic drawing objects, both lower left options in the dialog are active. These options have the following effects. Fit to frame: The text is widened and compressed so that it fills out to the object frames. Adjust to contour: All the text is contained within the figure. It is split over several lines if necessary. Any text which does not fit in the figure is not shown, but is still retained.
If you anchor the text above, below, right or left, a positive spacing value positions the text in such a way that it sits close to the outside of the object frame at the anchoring point. Anchoring in the middle does not result in this movement. It is easier to add text to a straight line if the line is created as a very thin rectangle. Choose an anchor point in the middle of the rectangle and then determine the exact position of the text by setting the spacing accordingly.
Figure 235: Text options active for text frames and callouts All options off In versions of Draw before 3.2, the text is broken at the object frame. You do not see text that does not fit within the object frame. It is still available and if you enlarge the object it will be visible. In versions 3.2 and later, the breaking of the text at the frame border does not appear to function (this is probably a bug).
Fit height to text The height of the text frame or callout is enlarged so that all lines fit within the height of the object frame. Pictures and text Pictures also possess a text element. You can use this text element to place lettering over the picture or to give the picture a caption. To format this text, proceed in the same way as for a normal rectangle. Usually you produce text as a separate object and then group it with the picture, because this gives you more flexibility.
The construction of each example was carried out using a graphics style. Right-click on the picture and choose Edit Style to open the Graphics Styles dialog (Figure 232). You may first wish to choose a different style to edit for the picture, or create a new style for a special purpose. For more about styles, see Chapter 4 (Changing Object Attributes). If you store the picture using File > Export, the text is exported along with the graphic.
Double-click to enter text editing mode and replace the placeholder text “Fontwork” with your own text. Click outside the object or press the Esc key to leave editing mode. With the Area dialog from the Format menu or the context menu, you can set fill and shadow properties. Use the Line dialog to set a frame around the lettering. For further adjustments use the Fontwork toolbar. If this does not open automatically turn it on with View > Toolbars > Fontwork. The symbol on the far left is already familiar.
Writer OLE object In some cases, text frames are not flexible enough to meet your needs and offer too few possibilities for adjustment. For example, you may want to show a figure in Draw in exactly the form it was created in Writer. The best solution might be to insert an OLE object. This means that the object is linked or connected to the application that created it. Draw makes available to other applications (only) one viewing window. The object itself is not edited in Draw but in the other application.
With the handles of the gray frame you can determine which section of the entire text document is visible. You should switch off the ruler view. Figure 239: Editing in Writer as an OLE object Click outside the object to leave editing mode. Double-click on the object or use Edit > Object > Edit to change again into editing mode. In an embedded Writer OLE object, you can connect to further “sub” OLE objects.
Figure 241: Draw object behind an OLE object The page with the text document has the background property set to transparent. If you change the background color of the OLE object in Edit mode, it will also show in the Draw document. The Format menu has the entries Area and Line grayed out because they are not usable, but the menu entries Paragraph, Character, Text, and Bullets and Numbering are all available.
Direct drawing of a Bézier curve Open the Curve toolbar by clicking on the small black triangle of the symbol on the Drawing toolbar. Click on the Curve icon The mouse cursor changes to . . Click on the starting point of the curve and keep the mouse button pressed (starting and end points are shown here in the figures as snap points). Drag the mouse to approximately the position of your first control point.
Point mode of the Bézier curve After drawing a curve using the icon from the Draw toolbar or with the Edit points command from the context menu, you can switch to point mode from which you edit individual points on the curve. Points on the curve are shown with a square handle ; the control points with a round handle . The starting point of a curve appears somewhat larger than the other points. When you hover the mouse over a curve point the mouse cursor changes to - over a control point it changes to .
Transition points For the transition from one segment to the next, there are three different types of points, each with its own properties. Corner points This is the only common point between two segments which are otherwise independent of each other. It is likely that the curve has a kink at this point (depending on the angle of the tangents, the lines from the corner point to each control point; see Figure 242).
The circled icons are, from left to right, Corner point, Smooth transition, and Symmetric transition. The latter two icons appear the same but you can identify them by looking at the tooltip. At any time only one of the three icons will be active. To change the type of point, click on one of the other two icons. Note If you cannot see the control point for a segment, try changing the point type from Corner point to Smooth transition and then back again.
Transform a Bézier curve into a straight segment Select the larger of the two handles at the ends of the curve; this will be the starting point of the straight segment. After a short time the Convert to curve icon on the Edit Points toolbar becomes active. It starts in the “in” position. Click the icon to turn off the function. The Bézier curve segment is transformed into a straight line. The type of the segment end point remains as it was.
Combining closed curves If you draw a Bézier curve segment and, at the end point of the segment, click and hold the mouse button, followed by a single press of the Alt key, the curve is closed with a straight line and you are placed in Combining mode. You can now begin a second curve at an arbitrary point. Ending the drawing with a double-click also closes this curve. If you end it with an Alt-click as described above, you can draw further curves.
Type or paste your comment into the text box. You can optionally apply some basic formatting to parts of the text by selecting it, right-clicking, and choosing from the pop-up menu. From this menu, you can also delete the current comment, all the comments from the same author, or all the comments in the document. You can move the small comment markers to anywhere you wish on the page. Typically you might place it on or near an object you refer to in the comment.
Index 3 3D bodies 112 creating by body rotation 112 creating by extrusion 112 extrusion 112 ready-made objects 113 rotating 116 segments 121 settings 117 3D effects geometry 119 illumination 126 material 131 shading 123 textures 128 3D effects dialog 117 3D scenes 114 combining objects 134 3D settings for 3D shapes 3D color 134 depth 133 direction 133 illumination 134 surface 134 3D shapes extrusion 114 rotating 117 A add points 51 aging filter 100 aligning objects 85 Alpha channel 102 ambient lighting 128
curved text 170 curves 49 closing 199 combining closed curves 201 connecting 201 converting to 199 customizing toolbars 17 D delete points 52 delete unused backgrounds 153 Dimension Line style 180 dimension lines editing 182 placing 182 dimensioning 180, 181 display grid 141 distance camera parameter 125 distorting an image 74 distributing space between objects 86 dithering 104 double-sided illumination 123 Double-Sided tool 121 dragging and dropping 91 drawing arcs 31 arrows 27 banners 35 block arrows 34
H O half adder 176 handles 39 hatching 64 hidden objects 40 horizontal distribution of objects 87 HSB color model 155 hyphenation 186, 188 object specific effect 122 objects adjusting size 41 arranging 41 dynamic movement 42 dynamic size modification 43 editing points 48 framing 40 hidden 40 moving 41 re-sizing 42, 46 rotating 44, 47 selecting 40 slanting 45 OLE objects editing mode 193 inserting 193 object mode 194 Options toolbar 14, 39 organization charts 160, 164 I illumination color 132 illuminatio
reducing color depth 103 relief filter 101 remove noise 99 removing links to files 90 renaming objects 95 RGB colors 96, 154 rotating 3D objects 116 rotating an object 44, 72 rotation angle of 3D bodies 121 rotation mode 54 rounding of 3D object 119 rulers 9 S scale drawings 172 scaled depth of 3D object 120 segments of 3D bodies 121 selecting objects 40 selection mode 39, 40 send backward 41 send document as e-mail 23 send to back 84 set in circle (perspective) 74 set to circle (slant) 75 shading of 3D ob