WiPry 2500x User Manual 2.
Table of Contents Section 1 Getting Started 1.10 Quickstart Guide 1.20 Compatibility Section 2 How WiPry Works 2.10 Basics 2.11 Screen Layout 2.12 Color Legend 2.20 How To Solve Wireless Speed Issues 2.21 Avoid Interference 2.22 Educate Customer 2.23 Identify Interference Source 2.24 Optimize Channel 2.25 Undo/Relocate Hardware (Features used: Decay, Heat Map) (Features used: AP Utilization) (Features used: Heat Map) (Features used: Channel Guide) (Features used: Signal to Noise Ratio) 2.
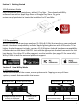
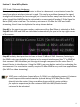
Section 1 Getting Started 1.10 Quickstart Guide Insert hardware into smartphone, tablet, PC or Mac. Then download WiPry software from either Apple App Store or Google Play Store. Or, go to oscium.com/quickstart to locate the installers for PC and Mac. 1.20 Compatibility WiPry is a dual band spectrum analyzer (2.4 GHz & 5 GHz) that works on your preferred device. Hardware compatibility includes Apple lightning devices with iOS version 7.0 or higher. Android support includes version 4.0.3 & higher.
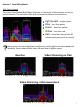
Section 2 How WiPry Works 2.11 Screen Layout The screen is split into two views. The top view is Real Wave. This represents real time spectral data. The bottom view is Waterfall. Waterfall enables spectral data to be viewed over time with the most recent data at the top of the view. Older data ‘falls’ down the screen. Play record feature Although all RF transmissions are captured by WiPry 2500x, not all RF activity is constant. Some activity appears and then disappears.
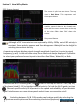
Section 2 How WiPry Works 2.11 Color Legend The colors listed below (Real Wave) illustrate a ‘heat map’ of the wireless activity as pictured below. The hot colors (like red) represent continuous transmissions. Light purple - single packet Blue - less than green Green - less than yellow Yellow - less than red Red - noise floor (more than 20 transmissions per point on screen) Red activity can cause significant interference, which affects wireless speed and reliability.
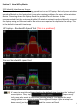
Section 2 How WiPry Works 2.21 Avoid Interference Interference across the entire 2.4 GHz spectrum is visualized below. Here’s how to duplicate the setup shown below: Step #1 The default view includes the heat map, which is the setting that displays the colors below. Step #2 In this illustration, decay is also enabled. Decay is the white squiggly line that provides an average of the signal, which fades (or decays) over time. Enabling decay can be done by tapping the ‘spectrum’ menu in the bottom left corner.
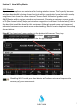
Section 2 How WiPry Works 2.22 Educate Apartment complexes are notorious for having wireless issues. That’s partly because wireless bandwidth is being shared not just within a particular home but with nearby neighbors that share the same channel. ‘Access Point Utilization’ grades each AWG/Router within a given wireless environment. Showing a customer a poor grade of D (like shown below) helps put wireless congestion in context. Unfortunately, this is the best that could be done for this customer.
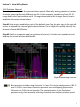
Section 2 How WiPry Works 2.23 Identify Interference Source This screenshot was captured during speed test on an HP laptop. Not only were wireless speeds affected on the laptop but it was also causing problems for every other wireless device. Powering down the laptop fixed the problem for all devices. It was recommended that the customer disable HP wireless network card and directly connect the laptop using an Ethernet cable. No actions are required to duplicate the setup.
Section 2 How WiPry Works 2.24 Optimize Channel Not every channel yields the same wireless speeds. Manually testing speeds on various channels gives significantly different results. In this example, speeds vary from 23-31 megs down after optimization and 4.74 megs down before the change. Here’s how to duplicate the setup shown below: Step #1 Heat map is enabled as part of the default view. Tap the plus sign in the top left corner to expand the channel guide shown below.
Section 2 How WiPry Works 2.25 Undo / Relocate Hardware Convenient setup of the AWG/Router is often in a basement or mechanical room far away from where wireless internet is used. This can be a problem because the signal strength will attenuate (or lose strength) as it travels further away from the source. So when should the AWG/Router be relocated to a more central location? If the Signal to Noise (SNR) ratio is too low. The industry minimum is 25 dBm for VOIP and video streaming.
Section 2 How WiPry Works 2.31 Waterfall Mode One of the challenges with RF is that the environment is constantly changing. The default setting on our app is for a real wave view. This displays activity in real time. But interference can come and go. Waterfall displays RF over time. The newest activity is at the top of the screen. And it ‘falls’ down the screen as time elapses. The oldest activity is at the bottom of the screen. Selecting Both allows both Real Wave & Waterfall views.
Section 2 How WiPry Works 2.32 Screenshots / Email Capturing and emailing screenshots is helpful for supervisors . Difficult wireless issues can be forwarded to managers or Wi-Fi experts for immediate feedback. Here’s how to capture screenshots and use email inside the WiPry app: Step #1 Tap ‘settings’ menu option. Step #2 Then, tap and a picture of the screen will be captured and emailed (see image below). Or, if multiple screenshots are needed, tap instead and images will be stored in photos.
Section 2 How WiPry Works 2.33 Datalogging Datalogging creates a record of activity while using the WiPry tool. Although it is possible to log as long as there is battery life on the iOS device, the data is represented by numbers in a CSV file. This is a bit cryptic without a way to re-create the waveforms. So, it is not recommended that this feature be used for this application. 2.34 PC/Mac Installer The PC version of WiPry 2500x can be found by following this link: https://www.oscium.
Section 2 How WiPry Works 2.35 Other Features Average – provides a yellow line that averages the signal. Very similar to decay functionality described in more detail on page six. Raw – represents the raw spectral data and is visualized by the blue squiggly line. The problem with raw view is the signals are so fast that it’s impossible to do anything with the data.
Section 2 How WiPry Works 2.35 Birth Certificate / Reporting Step 1 Tap any displayed SSID. In the top right corner, critical details for that SSID are displayed: Step 2 Tap Measure menu option. At the bottom, note Site Evaluation option. Tap Generate Report.
Section 2 How WiPry Works 2.36 Other Features ZigBee – Viewing ZigBee’s specific channel guide is helpful for troubleshooting ZigBee systems. To access this feature: Step 1 Tap the measure menu option. Then, scroll down and tap 802.15.4 – ZigBee. Step 2 The ZigBee channel guide has been loaded. Now tap in in the top left corner. Since most AWG/Router’s default to channels 1, 6 or 11, the best ZigBee channels to use are often 15, 20 or 25.
Reference Access Point Utilization (2, 7) Apartment Complex (7) Android (3) Average (2, 14) Avoid interference (6) AWG / Router (7, 9, 10) Bandwidth Speed Test (5, 8, 9, 11) Battery ( Birth Certificate (15) Best Practices (2, 4, 7, 8, 9, 10, 11, 15) Channel Guide (2, 4, 6, 9) Color legend (2, 5) Compatibility (3) Countdown, 2-minute (7) Cordless phone (10) Cursors (10) Data Logging (13) Directional Antenna (2, 13) Decay (2, 6) Educate Customer (7) Email (2, 12) Extension Cable (3) Field Applications (2, 4,