
Manual
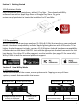
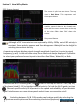
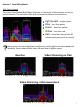

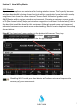
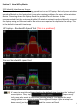
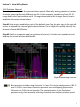
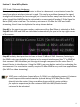
Table Of Contents

The screen is split into two views. The top
view is Real Wave. This represents real
time spectral data.
The bottom view is Waterfall. Waterfall
enables spectral data to be viewed over
time with the most recent data at the top
of the view. Older data ‘falls’ down the
screen.
Play record feature
Section 2 How WiPry Works
2.11 Screen Layout
To enable the Wi-Fi channel guide, tap located in the top left corner. Then, tap any
of the boxes listed (1-13) to highlight channel activity. To hide the Wi-
Fi guide, just tap
. . Channel-specific activity is important to the speed and reliability of your wireless
signal. Interference can cause slow speeds and at times no connection at all.
4
Although all RF transmissions are captured by WiPry 2500x, not all RF activity is
constant. Some activity appears and then disappears. Waterfall can be helpful in
catching intermittent activity.
A spectrum analyzer displays signal strength amplitude (x axis) as it varies by signal
frequency (y axis). In the real wave view, these labels are always displayed. It possible
to select your preferred screen layout to be either Real Wave, Waterfall, or Both.
Switching between 2.4 & 5 GHz modes can be done quickly by selecting the
spectrum menu option and then selecting the desired frequency: