
Operation Manual


The Outpost Log System
81
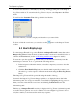
You can locate data more comfortably by showing or hiding specific parts of the Outpost
Log Viewer window. To customize the Log Viewer’s layout, select Layout on the View
menu.
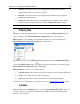
You will see the Customize View dialog, which looks like this:
Select the elements you want to display and clear those you want to hide.
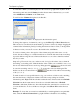
To show or hide the console tree, you can also use the
button on the Outpost Viewer
toolbar.
6.3 How to Display Logs
To view Outpost Firewall’s logs, select Tools from Outpost Firewall’s menu, then select
Outpost Log Viewer. Select the items of interest in the console tree as described below or
switch to the Favorites tab (see the
6.5 Working with Favorites chapter for details).
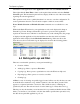
You can also open the specific Log Viewer entry you are interested in directly from the
main Outpost’s window. To do so, perform the following actions:
1. In the left panel of the main window, select the component you want to view the
statistics for.
2. Click the Show Detailed Log button on the information panel if you want to see
the entire log or select a preset or filter from the menu using the Show Log Preset
button.
The Outpost Log Viewer will be opened showing the details of the log.
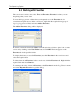
Content in the Outpost Log Viewer changes quickly so to display the latest data in the
information panel, don’t forget to refresh it occasionally by highlighting the log, preset or
filter you want to refresh in the console tree and clicking the Refresh button in the
information panel.
The history of Outpost Firewall’s activity is displayed in Log Viewer’s information panel
as a table. Every log has its own set of columns. You can configure Log Viewer to show
only the columns you are interested in and in any sequence.