
User's Manual

Monitoring and Troubleshooting
7-15
8700-A2-GB20-00
April 2000
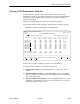
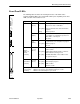
Viewing G.703 Performance Statistics
G.703 performance statistics allow you to monitor the current status of the
network DSL operations. Performance statistics can assist you in determining the
duration of specific conditions and provide a historical context for problem
detection and analysis.
Statistics are maintained for up to 96 15-minute intervals (24 hours).
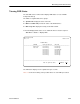
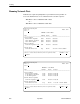
To view the G.703 Performance Statistics, follow this menu selection sequence:
Main Menu →Status →Performance →G.703 Statistics
main/status/performance/G.703
Slot: 4 Model: 87xx
Port: 2
G.703 PERFORMANCE STATISTICS
Current Interval Timer: 004 Error Events Counter: 012
–––––––––––––––––––––––––––––––––––––––––––––––––––––––––––––––––––––––––––––––
––ES–– ––UAS–– ––SES–– ––BES–– ––CSS–– –LOF– –Status–
Current Int: 000 000 000 000 000 000 Y
Interval 01
000 000 000 000 000 000 none
Interval 02
000 000 000 000 000 000 none
Interval 03
000 000 000 000 000 000 none
Interval 04
000 000 000 000 000 000 none
Interval 05
000 000 000 000 000 000 none
Interval 06
000 000 000 000 000 000 none
Interval 07
000 000 000 000 000 000 none
Worst Interval: 24 14 14 09 18 12
Tot (valid 96): 00010 00000 00000 00000 0020 0000
–––––––––––––––––––––––––––––––––––––––––––––––––––––––––––––––––––––––––––––––
Ctrl–a to access these functions, ESC for previous menu M
ainMenu Exit
PgU
p PgDn ClrStats
Select a port to view the performance statistics. The default port is 1.
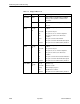
G.703 Performance Statistics are collected for all ports for:
H ES (Errored Seconds): Seconds during which one or more error events
occurred.
H UAS (Unavailable Seconds): Seconds during which service is unavailable.
UAS is received at the start of 10 consecutive SES and cleared at the start of
10 seconds with no SES.
H SES (Severely Errored Seconds): Seconds during which 805 or more cyclic
redundancy check (CRC) error events, 16 or more FAS errors, or at least one
Out of Frame (OOF) event occurred.