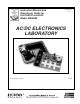
Includes Teacher's Notes and Typical Experiment Results Instruction Manual and Experiment Guide for the PASCO scientific Model EM-8656 012-05892A 1/96 AC/DC ELECTRONICS LABORATORY © 1995 PASCO scientific $15.
012-05892A AC/DC Electronics Laboratory Table of Contents Section ...........................................................................................................Page Copyright, Warranty, and Equipment Return ................................................. ii Introduction ..................................................................................................... 1 Equipment ........................................................................................................
AC/DC Electronics Laboratory 012-05892A Copyright, Warranty and Equipment Return Please—Feel free to duplicate this manual subject to the copyright restrictions below. Copyright Notice Equipment Return The PASCO scientific Model EM-8656 AC/DC Electronics Laboratory manual is copyrighted and all rights reserved.
012-05892A AC/DC Electronics Laboratory Introduction The EM-8656 AC/DC Electronics Laboratory is designed for both DC and AC electricity experiments. The circuit board can be powered by batteries for DC experiments or it can be powered by a computer equipped with a Power Amplifier for AC experiments. The AC experiments could also be performed without a Power Amplifier if a function generator is available.
AC/DC Electronics Laboratory 012-05892A Getting Started ➀ Store the components in the Ziplock bag until needed. ➃ Students will need to use the same component layout Keep track of, and return the components to the Ziplock bag after the experiment is completed. from one experiment to another. Labeling of the boards and your meters will enable students to more easily have continuity in their work. Using removable labels or using a permanent marker are two alternatives for marking the board.
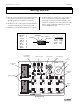
012-05892A AC/DC Electronics Laboratory Notes on the Circuits Experiment Board The springs are securely soldered to the board and serve as a convenient method for connecting wires, resistors and other components. Some of the springs are connected electrically to devices like the potentiometer and the D-cells. In the large Experimental Area, the springs are connected in pairs, oriented perpendicular to each other. This facilitates the connection of various types of circuits.
AC/DC Electronics Laboratory 012-05892A Comments on Meters VOM: VTVM: The Volt-Ohm-Meter or VOM is a multiple scale, multiple function meter (such as the PASCO SB-9623 Analog Multimeter), typically measuring voltage and resistance, and often current, too. These usually have a meter movement, and may select different functions and scales by means of a rotating switch on the front of the unit.
012-05892A AC/DC Electronics Laboratory Experiment 1: Circuits Experiment Board EQUIPMENT NEEDED: – AC/DC Electronics Lab Board: Wire Leads – D-cell Battery – Graph Paper Purpose The purpose of this lab is to become familiar with the Circuits Experiment Board, to learn how to construct a complete electrical circuit, and to learn how to represent electrical circuits with circuit diagrams. Background ➀ Many of the key elements of electrical circuits have been reduced to symbol form.
AC/DC Electronics Laboratory 012-05892A Procedure ➀ Use two pieces of wire to make connections between the springs on one of the light bulbs to the springs on the D-cell in such a way that the light will glow. Discuss with your lab partner before you begin actually wiring your circuit which connections you intend to make, and why you think you will be successful in activating the light.
012-05892A AC/DC Electronics Laboratory Experiment 2: Lights in Circuits EQUIPMENT NEEDED: – AC/DC Electronics Lab Board: Wire Leads – (2) D-cell Batteries – Graph Paper Purpose The purpose of this lab is to determine how light bulbs behave in different circuit arrangements. Different ways of connecting two batteries will also be investigated.
AC/DC Electronics Laboratory 012-05892A PART B ➆ Connect a single D-cell to a single light as in step 1, using a spring clip “switch” to allow you to easily turn the current on and off. Note the brightness of the light. ⑧ Now connect the second D-cell into the circuit as shown in Figure 2.1a. What is the effect on the brightness of the light? Figure 2.1b Figure 2.1a Figure 2.1c ⑨ Connect the second D-cell as in Figure 2.1b.
012-05892A AC/DC Electronics Laboratory Experiment 3: Ohm’s Law EQUIPMENT NEEDED: – AC/DC Electronics Lab Board: Wire Leads – D-cell Battery – Multimeter – Graph Paper Purpose The purpose of this lab will be to investigate the three variables involved in a mathematical relationship known as Ohm’s Law. Procedure ➀ Choose one of the resistors that you have been given. Using the chart on the next page, decode the resistance value and record that value in the first column of Table 3.1.
AC/DC Electronics Laboratory 012-05892A Data Processing ➀ Construct a graph of Current (vertical axis) vs Resistance. ➁ For each of your sets of data, calculate the ratio of Voltage/Resistance. Compare the values you calculate with the measured values of the current. Table 3.
012-05892A AC/DC Electronics Laboratory Experiment 4: Resistances in Circuits EQUIPMENT NEEDED: – AC/DC Electronics Lab Board: Resistors – Multimeter Purpose The purpose of this lab is to begin experimenting with the variables that contribute to the operation of an electrical circuit. This is the first of a three connected labs. Procedure ➀ Choose three resistors of the same value. Enter those sets of colors in Table 4.1 below. We will refer to one as #1, another as #2 and the third as #3.
AC/DC Electronics Laboratory 012-05892A Series R1 R2 R3 R12= R23= ➤ R12 ➤ ➤ ➤ R23 R123= ➤ ➤ R123 Figure 4.1 ➅ Construct a PARALLEL CIRCUIT, first using combinations of two of the resistors, and then using all three. Measure and record your values for these circuits. Parallel R1 ➤ NOTE: Include also R13 by replacing R2 with R3. ➤ ➆ Connect the COMBINATION CIRCUIT below and measure the various combinations of resistance.
012-05892A AC/DC Electronics Laboratory Table 4.2 Colors 2nd 3rd 1st Coded Measured 4th Resistance Resistance % Error A B C Series RA RB RC RAB = RAB RBC = ➤ RBC ➤ ➤ RABC ➤ ➤ ➤ Figure 4.4 Parallel RA RAB RAB = ➤ ➤ RBC = RB RABC= RC Figure 4.5 ➤ NOTE: Include also RAC by replacing RB with RC.
AC/DC Electronics Laboratory 012-05892A Combination RB RA RA = RC RBC = ➤ ➤ RA ➤ ➤ RBC RABC RABC= ➤ Figure 4.6 Discussion ➀ How does the % error compare to the coded tolerance for your resistors? ➁ What is the apparent rule for combining equal resistances in series circuits? In parallel circuits? Cite evidence from your data to support your conclusions.
012-05892A AC/DC Electronics Laboratory Experiment 5: Voltages in Circuits EQUIPMENT NEEDED: – AC/DC Electronics Lab Board: Wire Leads, Resistors – D-cell Battery – Multimeter Purpose The purpose of this lab will be to continue experimenting with the variables that contribute to the operation of an electrical circuit. You should have completed Experiment 4 before working on this lab.
AC/DC Electronics Laboratory 012-05892A ➂ Now connect the parallel circuit below, using all three resistors. Measure the voltage across each of the resistors and the combination, taking care with the polarity as before. ➤ NOTE: Keep all three resistors connected throughout the time you are making your measurements. Write down your values as indicated below. Parallel + - ➤ ➤ R1 R1 = V1 = R2 = V2 = R3 = V3 = R123 = V123 = V1 R2 R3 Figure 5.
012-05892A AC/DC Electronics Laboratory Series + - VA + RA RC RB - + - + - + ➤ ➤ VAB ➤ VBC VABC ➤ ➤ ➤ Figure 5.4 RA = VA = RB = VB = RC = VC = RAB = VAB = RBC = VBC = RABC= VABC= Parallel + - ➤ ➤ RA VA RB RA = VA = RB = VB = RC = VC = RABC= VABC= RC Figure 5.
AC/DC Electronics Laboratory 012-05892A Combination + - RA = VA = RBC = VBC = RABC= VABC = RB RA RC ➤ VA ➤ VABC VBC ➤ ➤ ➤ ➤ Figure 5.6 Discussion On the basis of the data you recorded on the table with Figure 5.1, what is the pattern for how voltage gets distributed in a series circuit with equal resistances? According to the data you recorded with Figure 5.
012-05892A AC/DC Electronics Laboratory Experiment 6: Currents in Circuits EQUIPMENT NEEDED: – AC/DC Electronics Lab Board: Resistors and Wire Leads – D-cell Battery – Digital Multimeter Purpose The purpose of this lab will be to continue experimenting with the variables that contribute to the operation of electrical circuits.
AC/DC Electronics Laboratory 012-05892A - I0 + + - R1 - + I2 R3 R2 + I1 + - I3 - Figure 6.3 R1 = I0 = V1 = R2 = I1 = V2 = R3 = I2 = V3 = R12 = I3 = V12 = R23 = V23 = R123= V123= ➃ Connect the parallel circuit below, using all three resistors. Review the instructions for connecting the DMM as an ammeter in step 2. Connect it first between the positive terminal of the battery and the parallel circuit junction to measure I0.
012-05892A AC/DC Electronics Laboratory Experiment 7: Kirchhoff’s Rules EQUIPMENT NEEDED: – AC/DC Electronics Lab Board: Resistors, Wire Leads – (2) D-cell Batteries – Digital Multimeter (DMM) Purpose The purpose of this lab will be to experimentally demonstrate Kirchhoff’s Rules for electrical circuits. Procedure ➀ Connect the circuit shown in Figure 7.1a using any of the resistors you have except the 10 Ω one. Use Figure 7.1b as a reference along with 7.1a as you record your data.
AC/DC Electronics Laboratory 012-05892A Table 7.1 Resistance, Ω Voltage, volts Current, mA R1 V1 I1 R2 V2 I2 R3 V3 I3 R4 V4 I4 R5 V5 I5 RT VT IT Analysis ➀ Determine the net current flow into or out of each of the four “nodes” in the circuit. ➁ Determine the net voltage drop around at least three (3) of the six or so closed loops. Remember, if the potential goes up, treat the voltage drop as positive (+), while if the potential goes down, treat it as negative (-).
012-05892A AC/DC Electronics Laboratory Experiment 8: Capacitors in Circuits EQUIPMENT NEEDED: – AC/DC Electronics Lab Board: Capacitors, Resistors, Wire Leads – D-cell Battery – Stopwatch or timer with 0.1 sec resolution. – Vacuum Tube Voltmeter (VTVM) or Electrometer (ES-9054B) or Digital Multimeter (DMM) that has an input impedance of 10 MΩ or greater. Purpose The purpose of this lab will be to determine how capacitors behave in R-C circuits.
AC/DC Electronics Laboratory 012-05892A Table 8.1 Trial Resistance Capacitance tC tD 1 2 3 4 5 6 7 8 ⑧ Replace the 100 µF capacitor with a 330 µF capacitor. Repeat step 7, recording the charging and discharging times in Table 8.1. If a third value is available, include it in the data table, too. ⑨ Return to the original 100 µF capacitor, but put a 220 kΩ resistor in the circuit. Repeat step 7, recording your data in Table 8.1.
012-05892A AC/DC Electronics Laboratory Experiment 9: Diodes EQUIPMENT NEEDED: – AC/DC Electronics Lab Board: 1 KΩ Resistor, 330 Ω Resistor, 1N4007 Diode, Wire Leads – Digital Multimeter (DMM) – (2) D-cell Batteries Purpose The purpose of this lab will be to experimentally determine some of the operating characteristics of semiconductor diodes. Procedure À Connect the circuit shown in Figure 9.1a using the 1N4007 diode you’ve been supplied and the 1 KΩ resistor. Use Figure 9.
AC/DC Electronics Laboratory 012-05892A Discussion Discuss the shape of your graph and what it means for the operation of a semiconductor diode. Did the diode operate the same in steps 3 and 4 as it did in step 5? In steps 3 and 4 the diode was “Forward Biased”, while it was “Reverse Biased” in step 5. Based on your data, what do you think these terms mean? What use might we have for diodes? Sample Data Table Diode Type ____________ Forward Bias Reverse Bias Table 9.
012-05892A AC/DC Electronics Laboratory Experiment 10: Transistors EQUIPMENT NEEDED: – AC/DC Electronics Lab Board: 1 kW Resistor, 100 Ω Resistor, 2N3904 Transistor (NPN), Wire Leads – (2) D-cell Batteries – Digital Multimeter (DMM) – Optional: additional Digital Multimeter Purpose The purpose of this lab will be to experimentally determine some of the operating characteristics of a transistor. Procedure ➀ Connect the circuit shown in Figure 10.1a using the 2N3904 Transistor you’ve been supplied.
AC/DC Electronics Laboratory 012-05892A Analysis ➀ For each of your sets of readings, calculate: IB = VAB / R1 and IC = VCD / R2 Record all of your current readings in mA. ➁ Plot a graph of IC (vertical axis) vs IB. If you find an area or areas where you need more points to fill out any curves or sudden changes, simply return to step 2 and make the appropriate measurements.
012-05892A AC/DC Electronics Laboratory Experiment 11: Ohm's Law II EQUIPMENT NEEDED: – Computer and Science Workshop™ Interface – Power Amplifier (CI-6552A) – AC/DC Electronics Lab Board (EM-8656): 10 Ω resistor, 3 V light bulb, and wire leads – (2) banana plug patch cords (such as SE-9750) Purpose The purpose of this experiment is to investigate the relationship between current and voltage in Ohmic and non-Ohmic materials.
AC/DC Electronics Laboratory 012-05892A ➂ In the Physics Folder of the Science Workshop Experiment Library, open the document: Macintosh: “P46 Ohm's Law” / Windows: “P46_OHM.SWS” The document opens with a Scope (oscilloscope) display of Voltage (V) versus Current (A), and the Signal Generator window which controls the Power Amplifier. ➤ NOTE: For quick reference, see the Experiment Notes window.
012-05892A AC/DC Electronics Laboratory ➄ The Signal Generator is set to output 3.00 V, triangle AC waveform, at 60.00 Hz. ➅ The Scope is set to show Output Voltage on the vertical axis at 1.000 v/div and Current (Analog A) on the horizontal axis at 0.100 v/div. ➆ Arrange the Scope display and the Signal Generator window so you can see both of them. PART II: Sensor Calibration and Equipment Setup • You do not need to calibrate the Power Amplifier.
AC/DC Electronics Laboratory 012-05892A ➃ Select the Scope display. Analyzing the Data – Resistor (10 Ω) ➀ Click the “Smart Cursor” button ( ) in the Scope. The cursor changes to a cross-hair. Move the cursor into the display area of the Scope. • The Y-coordinate of the cursor/cross-hair is shown next to the Vertical Axis Input button: .
012-05892A AC/DC Electronics Laboratory slope (10 Ω) = ________ Volts/Amps Optional ➀ Replace the 10 Ω resistor with the 100 Ω resistor. ➁ Click the “Increase Sweep Speed” button ( ) in the Scope display to change the sensitivity of the horizontal axis to 0.010 v/div. ➂ Repeat the experiment. Record the new slope.
AC/DC Electronics Laboratory 012-05892A ➂ Click on the Frequency value to highlight it. Type in “0.30” as the new value. Press the “enter” key. ➃ Click the Scope display to make it active. • You will change the rate at which the scope is sampling data. ➄ Click the “Horizontal Input” button. Use the Horizontal Input menu to select “Time Input” (at the bottom of the list).
012-05892A AC/DC Electronics Laboratory PART II: Equipment Setup for Light Bulb Filament ➀ Remove the resistor from the component springs on the AC/DC Electronics Lab Board. ➁ Use two of the 10” wire leads to connect between the component springs near the banana jacks and the component springs above and below 3 VOLT BULB “C”. KIT NO. C 3.
AC/DC Electronics Laboratory 012-05892A ➀ Turn on the switch on the back of the Power Amplifier. ➁ Click the “ON” button in the Signal Generator window. ➂ Click the “MON” button in the Experiment Setup window to begin monitoring data. Observe the Scope display of Voltage versus Current for the light bulb filament. ➃ Wait a few seconds, then click the “STOP” button. ➄ Click the “OFF” button in the Signal Generator window. Turn off the power switch on the back of the Power Amplifier.
012-05892A AC/DC Electronics Laboratory Experiment 12: RC Circuit EQUIPMENT NEEDED: – Computer and Science Workshop™ Interface – Power Amplifier (CI-6552A) – Voltage Sensor (CI-6503) – AC/DC Electronics Lab Board (EM-8656): 100 Ω resistor and 330 µF capacitor – (2) banana plug patch cords (such as SE-9750) – LRC meter (optional) Purpose The purpose of this experiment is to investigate how the voltage across a capacitor varies as it charges and to find the capacitive time constant.
AC/DC Electronics Laboratory 012-05892A Procedure PART I: Computer Setup ➀ Connect the Science Workshop interface to the computer, turn on the interface, and turn on the computer. ➁ Connect the Voltage Sensor to Analog Channel A. Connect the Power Amplifier to Analog Channel B.
012-05892A AC/DC Electronics Laboratory ➤ Note: For quick reference, see the Experiment Notes window. To bring a display to the top, click on its window or select the name of the display from the list at the end of the Display menu. Change the Experiment Setup window by clicking on the “Zoom” box or the Restore button in the upper right hand corner of that window. ➃ The “Sampling Options…” for this experiment are: Periodic Samples = Fast at 1000 Hz and Stop Condition = 4.00 seconds.
AC/DC Electronics Laboratory 012-05892A ➃ When data recording is complete, turn off the switch on the back of the Power Amplifier. Analyzing the Data ➀ Click the “Autoscale” button ( ) in the Graph to rescale the Graph to fit the data. ➁ Click the “Magnifier” button ( ). Use the cursor to click-and-draw a rectangle over a region of the plot of Voltage versus Time that shows the voltage rising from zero volts to the maximum volts.
012-05892A AC/DC Electronics Laboratory ➂ Click the “Smart Cursor” button ( ). The cursor changes to a cross-hair when you move the cursor into the display area of the Graph. • The Y-coordinate of the cursor/cross-hair is shown next to the vertical axis. • The X-coordinate of the cursor/cross-hair is shown next to the horizontal axis. ➃ Move the cursor to the point on the plot where the voltage begins to rise. Record the time that is shown in the area below the horizontal axis.
AC/DC Electronics Laboratory 012-05892A Questions ➀ The time to half-maximum voltage is how long it takes the capacitor to charge halfway. Based on your experimental results, how long does it take for the capacitor to charge to 75% of its maximum? ➁ After four “half-lifes” (i.e.
012-05892A AC/DC Electronics Laboratory Experiment 13: LR Circuit EQUIPMENT NEEDED: – Computer and Science Workshop™ Interface – Power Amplifier (CI-6552A) – (2) Voltage Sensor (CI-6503) – AC/DC Electronics Lab Board (EM-8656): inductor coil & core, 10 Ω resistor, wire leads – Multimeter – (2) banana plug patch cords (such as SE-9750) – LCR (inductance-capacitance-resistance) meter (optional) Purpose This experiment displays the voltages across the inductor and resistor in an inductor-resistor circuit (
AC/DC Electronics Laboratory 012-05892A Since the voltage across an inductor is given by V L = L dI , the voltage across the inductor dt starts at its maximum and then decreases exponentially: V L = Voe −( t τ ) After a time t >> t, a steady-state current Imax is established and the voltage across the resistor is equal to the applied voltage, Vo. The voltage across the inductor is zero.
012-05892A AC/DC Electronics Laboratory The document opens with a Graph display of Voltage (V) versus Time (sec), and the Signal Generator window which controls the Power Amplifier. ➤ NOTE: For quick reference, see the Experiment Notes window. To bring a display to the top, click on its window or select the name of the display from the list at the end of the Display menu. Change the Experiment Setup window by clicking on the “Zoom” box or the Restore button in the upper right hand corner of that window.
AC/DC Electronics Laboratory 012-05892A ➁ Connect the 10 Ω resistor (brown, black, black) to Channel A between the component spring at the left hand edge of the inductor coil, and the second component spring to the left of the top banana jack. KIT NO. ➂ Connect another 5 inch wire lead between the component spring nearest to the one in which one end of the 10 Ω resistor is connected, and a component spring nearest to the bottom banana jack at the lower right corner of the AC/DC Electronics Lab Board.
012-05892A AC/DC Electronics Laboratory ➀ Click the “Smart Cursor” button ( ) in the Scope. The cursor changes to a cross-hair. Move the cursor into the display area of the Scope. • The Y-coordinate of the cursor/cross-hair is shown next to the Vertical Axis. • The X-coordinate of the cursor/cross-hair is shown next to the Horizontal Axis. ➁ Move the cursor/cross-hair to the top of the exponential part of the curve when the plot of voltage across the resistor (Analog Channel B) is at its maximum.
AC/DC Electronics Laboratory 012-05892A ➃ Subtract the time for the peak voltage from the time for the half-max voltage to get the time for the voltage to reach half-max. Record this time in the Data Table. ➄ Based on the total resistance in the circuit and the stated value for the inductance of the inductor L coil (8.2 millihenry or 0.0082 mH), calculate τ = .
012-05892A AC/DC Electronics Laboratory Experiment 14: LRC Circuit EQUIPMENT NEEDED: – Computer and Science Workshop™ Interface – Power Amplifier (CI-6552A) – Voltage Sensor (CI-6503) – AC/DC Electronics Lab Board (EM-8656): inductor coil & core, 10 Ω resistor, 100 µF capacitor, wire lead – LCR (inductance-capacitance-resistance) meter (SB-9754) – (2) banana plug patch cords (such as SE-9750) – graph paper Purpose The purpose of this experiment is to study resonance in an inductor-resistor-capacitor cir
AC/DC Electronics Laboratory 012-05892A Procedure PART I: Computer Setup ➀ Connect the Science Workshop interface to the computer, turn on the interface, and turn on the computer. ➁ Connect the Power Amplifier to Analog Channel A. Plug the power cord into the back of the Power Amplifier and connect the power cord to an appropriate electrical receptacle. ➂ Connect the Voltage Sensor to Analog Channel B.
012-05892A AC/DC Electronics Laboratory ➤ NOTE: For quick reference, see the Experiment Notes window. To bring a display to the top, click on its window or select the name of the display from the list at the end of the Display menu. Change the Experiment Setup window by clicking on the “Zoom” box or the Restore button in the upper right hand corner of that window. ➃ The Signal Generator is set to output 3.00 V, sine AC waveform, at 10.00 Hz.
AC/DC Electronics Laboratory 012-05892A Part III: Data Recording ➀ Turn on the power switch on the back of the power amplifier. ➁ Click the “MON” button ( ) to begin data monitoring. Record the value of the frequency in the Data Table. • Use the Smart Cursor in the Scope to measure the source voltage and the resistor voltage. To find the resonant frequency of the LRC circuit, adjust the frequency in the Signal Generator window until the voltage across the resistor increases to a maximum value.
012-05892A AC/DC Electronics Laboratory ➈ Make fine adjustments to the frequency until the trace of voltage from Channel B is in phase with the trace of Output Voltage. You can adjust the frequency by clicking the “Up” or “Down” Frequency arrows while pressing the following modifier keys: To adjust the frequency Press this key while clicking 1 Hz Control 0.1 Hz Option 0.
AC/DC Electronics Laboratory 012-05892A c. Click the “MON” button to begin monitoring data again. Adjust the frequency in the Signal Generator window as needed to reach the resonant frequency. Record the resonant frequency. • When the two inputs are in phase, the Scope display in “X-Y” mode will show a diagonal line. Any phase difference will cause an oval trace. • XY mode at 40 Hz • XY mode at resonant frequency 11 Click the “STOP” button. Turn off the switch on the back of the power amplifier.
012-05892A AC/DC Electronics Laboratory Data Table Freq(Hz) Vo VR Freq(Hz) 10 90 20 100 30 110 40 120 50 130 60 140 70 150 Vo VR 80 Item Value Resonant frequency Hz Resonant angular frequency Hz Inductance mH Capacitance µF Theoretical resonant angular frequency Hz Questions ➀ How does your measured value for resonant angular frequency compare to the theoretical value for resonant angular frequency? Remember, Percent difference = theoretical − actual x100% theoretical ➁
AC/DC Electronics Laboratory 012-05892A Optional ➀ Use the voltage sensor in Analog Channel B to measure the peak voltage across each of the components of the circuit individually. The sum of these peak voltages do not equal the applied peak voltage. Why not? Draw a phasor diagram to explain this. ➁ Determine whether the resonant frequency depends on the resistance. To see if the resistance makes a difference, set the Scope to the resonant frequency and then replace the 10 Ω resistor by a 100 Ω resistor.
012-05892A AC/DC Electronics Laboratory Experiment 15: Diode Lab – Part 1 EQUIPMENT NEEDED: – Computer and Science Workshop™ Interface – Power Amplifier (CI-6552A) – (2) Voltage Sensor (CI-6503) – AC/DC Electronics Lab Board (EM-8656) – (2) Banana plug patch cords (such as SE-9750) Purpose In this experiment, the properties of various type of diodes are investigated.
AC/DC Electronics Laboratory 012-05892A PROCEDURE: Unit One – Diode Properties PART I: Computer Setup ➀ Connect the Science Workshop interface to the computer, turn on the interface, and turn on the computer. ➁ Connect one Voltage Sensor to Analog Channel A. Connect the second Voltage Sensor to Analog Channel B. ➂ Connect the Power Amplifier to Analog Channel C. Plug the power cord into the back of the Power Amplifier and connect the power cord to an appropriate electrical receptacle.
012-05892A AC/DC Electronics Laboratory ➤ NOTE: For quick reference, see the Experiment Notes window. To bring a display to the top, click on its window or select the name of the display from the list at the end of the Display menu. Change the Experiment Setup window by clicking on the “Zoom” box or the Restore button in the upper right hand corner of that window. ➄ The Signal Generator is set to output 6.00 V, up-ramp AC waveform, at 2.00 Hz.
AC/DC Electronics Laboratory 012-05892A ➄ Connect the alligator clips of the Channel B voltage sensor to the wires at both ends of the 1 k resistor. ➅ Connect banana plug patch cords from the output of the Power Amplifier to the banana jacks on the AC/DC Electronics Lab Board. Part III: Data Recording - Diode and 1 k Resistor ➀ Turn on the power switch on the back of the power amplifier. ➁ Click the “ON” button ( ) in the Signal Generator window. ➂ Click the “REC” button ( ) to begin data recording.
012-05892A AC/DC Electronics Laboratory ➃ Use the cursor to click-and-draw a rectangle around the region of the plot of current and voltage where the current begins to increase. Make the rectangle tall enough so that its upper boundary is beyond 2 milliamp (mA). Click-and-draw rectangle around region of interest • The Graph will rescale to fit the data in the area you selected. ➄ Click the “Smart Cursor” button ( ). • The cursor changes to a cross-hair.
AC/DC Electronics Laboratory 012-05892A PROCEDURE: Unit Two – Light-Emitting Diodes PART I: Computer Setup • You do not need to change the computer setup. PART II: Sensor Calibration and Equipment Setup ➀ Prepare the red, yellow, and green LED’s by very carefully bending the wire leads so they can fit in the component springs in place of the diode you used in Unit One. ➁ Replace the diode from Unit One with the first LED (red). Arrange the first LED so the short lead (cathode) is to the left.
012-05892A AC/DC Electronics Laboratory ➃ Click the “Magnifier” button ( ). The cursor changes to a magnifying glass shape. ➄ Use the cursor to click-and-draw a rectangle around the region of the plot of current and voltage where the current begins to increase. Make the rectangle tall enough so that its upper boundary is beyond 2 milliamp (mA). ➅ Click the “Smart Cursor” button ( ). ➆ Move the cursor/cross-hair to the point on the plot where the current reaches 2 milliamps.
AC/DC Electronics Laboratory 012-05892A ANALYZING THE DATA: Bi-Color LED ➀ Select “Save As…” from the File menu to save your data. ➁ Select “Run #5” from the bottom of the Experiment menu. ➂ Click the “Autoscale” button ( ) to resize the Graph to fit the data. ➃ Click the “Magnifier” button ( ). The cursor changes to a magnifying glass shape.
012-05892A AC/DC Electronics Laboratory Data Table 2: Bi-Color LED Description Voltage (V) at 2 mA Voltage (V) at -2 mA 5.
AC/DC Electronics Laboratory 012-05892A 66 ®
012-05892A AC/DC Electronics Laboratory Experiment 16: Diode Lab – Part 2 EQUIPMENT NEEDED: – Computer and Science Workshop™ Interface – Power Amplifier (CI-6552A) – (2) Voltage Sensor (CI-6503) – AC/DC Electronics Lab Board (EM-8656) – (2) Banana plug patch cords (such as SE-9750) Purpose In this experiment, diodes are used to rectify an AC signal, and to build part of the basic circuitry of a power supply.
AC/DC Electronics Laboratory 012-05892A ➂ Connect the Power Amplifier to Analog Channel C. Plug the power cord into the back of the Power Amplifier and connect the power cord to an appropriate electrical receptacle. ➃ In the Physics Folder of the Science Workshop Experiment Library, open the document: Macintosh: “P53 Diodes Part 2” / Windows: “P53_DIO2.
012-05892A AC/DC Electronics Laboratory ➄ The Signal Generator is set to output 6.00 V, sine AC waveform, at 2.00 Hz. ➅ The periodic sampling rate is determined by the Scope display Sweep Speed. ➆ Arrange the Scope display and the Signal Generator window so you can see both of them. PART II: Sensor Calibration and Equipment Setup • You do not need to calibrate the Voltage Sensors or Power Amplifier.
AC/DC Electronics Laboratory 012-05892A • The “A” channel trace on the Scope display is the voltage across the diode. The “B” channel trace is the voltage across the resistor. ➃ To “capture” the data displayed in the Scope, click the “PAUSE” button ( ) to temporarily halt data monitoring when both traces are completely across the Scope screen. ➄ To save the data for the top trace, click the top “Data Snapshot” button ( ) in the right hand corner of the Scope display.
012-05892A AC/DC Electronics Laboratory ➇ Save the data for the other trace on the Scope display. Click the middle “Data Snapshot” button. Enter the needed information in the “Data Cache Information” window and then click “OK”. • The short names of the data caches will appear in the Data list in the Experiment Setup window. ➈ Click the “STOP” button. Click the “OFF” button ( ) in the Signal Generator window.
AC/DC Electronics Laboratory ➃ Click the “Add Plot” menu button ( 012-05892A ) at the lower left corner of the Graph. Select “Data Cache, Resistor Voltage” from the “Add Plot” menu. ➄ Click anywhere on the vertical axis of the top plot (Diode Voltage). The “Enter Plot Y Scale” window opens. ➅ Type in “6.5” for the Max and -6.5 for the Min, and then click “OK”. Repeat for the bottom plot (Resistor Voltage) • Both plots will have approximately the same scale for the vertical axis.
012-05892A AC/DC Electronics Laboratory PART IIIB: Data Recording - Rectifying a Sine Wave with a LED ➀ Remove the diode from the component springs. Carefully place a colored LED in the component springs. ➁ Repeat the data recording procedure as in Part IIIA. ➂ After you finish recording data, turn off the power switch on the back of the power amplifier. ANALYZING THE DATA: Rectifying a Sine Wave with a LED ➀ Repeat the data analysis procedure that followed Part IIIA.
AC/DC Electronics Laboratory 012-05892A ➄ Click on the Signal Generator window, or select it from the Experiment menu. Click on the frequency to highlight it. Type in “60” as the new frequency, and press “enter” on the keyboard. PART II: Sensor Calibration and Equipment Setup • You do not need to calibrate the sensors. ➀ Replace the 1 kΩ resistor with a 100 Ω resistor in the component springs near the bottom banana jack. The 100 Ω resistor will be the “load” resistor.
012-05892A AC/DC Electronics Laboratory ➃ Click the “STOP” button. ➄ Click the “Data Snapshot” button ( ) for the “B” channel. Enter Data Cache Information for “Long Name”, “Short Name”, and Units as needed to save the data for analysis. ➅ Click the “OFF” button ( ) in the Signal Generator window. PART IIIB: Data Recording – Diode and Capacitor ➀ Add the 470 µF capacitor in parallel to the 100 Ω resistor.
AC/DC Electronics Laboratory 012-05892A ➃ Click the “STOP” button. ➄ Click the “Data Snapshot” button ( ) for the “B” channel. Enter Data Cache Information for “Long Name”, “Short Name”, and Units as needed to save the data for analysis. ➅ Click the “OFF” button ( ) in the Signal Generator window. ➆ Put the 10 Ω resistor in parallel with the 100 Ω resistor and the 470 µF capacitor. The 10 Ω resistor simulates a motor or small light bulb.
012-05892A 12 AC/DC Electronics Laboratory Click the “OFF” button ( ) in the Signal Generator window. Turn off the power switch on the back of the power amplifier. ANALYZING THE DATA: Power Supply, Single Diode ➀ Select “Save As…” from the File menu to save your data. ➁ Select “New Graph” from the Display menu. ➂ Change the input. Click the “Input Menu” button ( ). Select “Data Cache, Rectified Voltage” from the Input Menu.
AC/DC Electronics Laboratory 012-05892A ➆ Type in “6.5” for the Max and -6.5 for the Min, and then click “OK”. ➇ Click anywhere on the vertical axis of the middle plot (Filtered Voltage). Type in “10” and “-10” for the Max and Min and then click “OK. Repeat for the bottom plot (Load Resistor Voltage) • Optional: If a printer is available, select “Print Active Display” from the File menu. PROCEDURE: Unit Four – Power Supply PART I: Computer Setup • You do not need to change the computer setup.
012-05892A AC/DC Electronics Laboratory ➅ Put the 100 Ω resistor diagonally between the upper left corner and the lower right corner of the square of diodes. (4) Diode Res to Power Amp ➆ Use a five inch wire lead to connect a component spring next to the top banana jack and the component spring at the RIGHT end of the first diode.
AC/DC Electronics Laboratory 012-05892A • The top trace is the voltage across the “load” resistor. (The other trace is the Output Voltage.) ➃ Click the “STOP” button. ➄ Click the “Data Snapshot” button ( ) for the “B” channel. Enter Data Cache Information for “Long Name”, “Short Name”, and Units as needed to save the data for analysis. ➅ Click the “OFF” button ( ) in the Signal Generator window. ➆ Put the 470 µF capacitor in parallel with the 100 Ω resistor.
012-05892A AC/DC Electronics Laboratory ➈ Click the “MON” button ( ) to begin data monitoring. ➉ Click the “STOP” button. 11 Click the “Data Snapshot” button ( ) for the “B” channel. Enter Data Cache Information for “Long Name”, “Short Name”, and Units as needed to save the data for analysis. 12 Click the “OFF” button ( 13 Put the 10 Ω resistor in parallel with the 470 µF capacitor and the 100 Ω resistor.
AC/DC Electronics Laboratory 012-05892A 16 Click the “STOP” button. 17 Click the “Data Snapshot” button ( ) for the “B” channel. Enter Data Cache Information for “Long Name”, “Short Name”, and Units as needed to save the data for analysis. 18 Click the “OFF” button ( ) in the Signal Generator window. Turn off the power switch on the back of the power amplifier. ANALYZING THE DATA: Four Diode Bridge ➀ Select “Save As…” from the File menu to save your data.
012-05892A AC/DC Electronics Laboratory ➃ Click the “Add Plot” menu button ( ) at the lower left corner of the Graph. Select “Data Cache, Filtered Full Rectified voltage” from the “Add Plot” menu. ➄ Click again on the “Add Plot” menu button ( ) at the lower left corner of the Graph. Select “Data Cache, Load Resistor Voltage” from the “Add Plot” menu. ➅ Click anywhere on the vertical axis of the top plot (Full rectified voltage). The “Enter Plot Y Scale” window opens.
AC/DC Electronics Laboratory 012-05892A Questions ➀ In Unit Three, how do the plots of voltage across the diode and voltage across the resistor compare to a complete sine wave? ➁ Based on your previous investigate of diodes, why do the plots of voltage across the diode and voltage across the resistor from the first part of Unit Three have the shape and size they do? ➂ In Unit Three, how did the plots of voltage across the diode and voltage across the resistor change when the diode was replaced with the
012-05892A AC/DC Electronics Laboratory Experiment 17: Transistor Lab 1 – The NPN Transistor as a Digital Switch EQUIPMENT NEEDED: – Computer and Science Workshop™ Interface – Power Amplifier (CI-6552A) – Voltage Sensor (CI-6503) – AC/DC Electronics Lab Board (EM-8656) – Regulated DC power supply of at least +5 Volts – Banana plug patch cords (such as SE-9750) Purpose The purpose of this experiment is to investigate how the npn transistor operates as a digital switch.
AC/DC Electronics Laboratory 012-05892A A transistor circuit can serve as a ‘digitial’ electric switch. In a mechanical electric switch, a small amount of power is required to ‘switch on’ an electrical device (e.g., a motor) that can deliver a large amount of power. In a ‘digital’ transistor circuit, a small amount of power supplied to the base is used to “switch on” a much larger amount of power from the collector. Here is some general information. A transistor is a three-terminal device.
012-05892A AC/DC Electronics Laboratory The document opens with a Graph display with a plot of “Vbase” (voltage to the base) in Volts (V) versus Time (sec), and a plot of “Vcollector” (voltage to the collector) in Volts (V) versus Time (sec), and the Signal Generator window which controls the Power Amplifier. ➤ NOTE: For quick reference, see the Experiment Notes window. To bring a display to the top, click on its window or select the name of the display from the list at the end of the Display menu.
AC/DC Electronics Laboratory 012-05892A PART II: Sensor Calibration and Equipment Setup • You do not need to calibrate the Voltage Sensor or Power Amplifier. ➀ Insert the 2N3904 transistor into the socket on the AC/DC Electronics Lab Board. The transistor has a half-cylinder shape with one flat side. The socket has three holes labeled “E” (emitter), “B” (base) and “C” (collector).
012-05892A AC/DC Electronics Laboratory ➈ Connect a black banana plug patch cord from the negative (-) terminal of the Power Amplifier to the negative terminal of the DC power supply. ➉ Put alligator clips on the banana plugs of the Voltage Sensor. Connect the red lead of the sensor to the component spring at the right end of the 330 Ω resistor and the black lead to the left end of the resistor.
AC/DC Electronics Laboratory ➄ Click the “OFF” button ( 012-05892A ) in the Signal Generator window. ➅ Turn off the power switch on the back of the power amplifier. Turn off the DC power supply. ANALYZING THE DATA ➀ Click on the Graph to make it active. Select “Save As…” from the File menu to save your data. ➁ Click the “Autoscale” button ( ) to rescale the Graph to fit the data. • Optional: If a printer is available, select “Print Active Display” from the File menu.
012-05892A AC/DC Electronics Laboratory Y-coordinate Smart Cursor ➅ Record the Y-coordinate of that point on the plot of Vbase.
AC/DC Electronics Laboratory 012-05892A 92 ®
012-05892A AC/DC Electronics Laboratory Experiment 18: Transistor Lab 2 – Current Gain: The NPN Emitter-Follower Amplifier EQUIPMENT NEEDED: – Computer and Science Workshop™ Interface – Power Amplifier (CI-6552A) – (2) Voltage Sensor (CI-6503) – AC/DC Electronics Lab Board (EM-8656) – Regulated DC power supply of at least +5 Volts – Banana plug patch cords (such as SE-9750) Purpose The purpose of this experiment is to investigate the direct current (DC) transfer characteristics of the npn transistor, an
AC/DC Electronics Laboratory 012-05892A PROCEDURE PART I: Computer Setup ➀ Connect the Science Workshop interface to the computer, turn on the interface, and turn on the computer. ➁ Connect one Voltage Sensor to Analog Channel A. Connect the other Voltage Sensor to Analog Channel B. ➂ Connect the Power Amplifier to Analog Channel C. Plug the power cord into the back of the Power Amplifier and connect the power cord to an appropriate electrical receptacle.
012-05892A AC/DC Electronics Laboratory ➤ NOTE: For quick reference, see the Experiment Notes window. To bring a display to the top, click on its window or select the name of the display from the list at the end of the Display menu. Change the Experiment Setup window by clicking on the “Zoom” box or the Restore button in the upper right hand corner of that window. ➄ The “Sampling Options…” are: Periodic Samples = 200 Hz, Start Condition is Analog Output = 0.01 V and Stop condition = Samples at 200.
AC/DC Electronics Laboratory 012-05892A ➆ Connect a red banana plug patch cord from the positive (+) terminal of the DC power supply to the top banana jack. ➇ Connect a red banana plug patch cord from the positive (+) terminal of the Power Amplifier to the component spring at the bottom end of the 22 kΩ resistor. ➈ Connect a black banana plug patch cord from the negative (-) terminal of the DC power supply to the component spring at the bottom end of the 1 kΩ resistor.
012-05892A AC/DC Electronics Laboratory 11 Put alligator clips on the banana plugs of both Voltage Sensors. Connect the black alligator clip of the Voltage Sensor in Analog Channel A to the component spring at the top end of the 22 kΩ resistor, and the red clip to the component spring at the bottom end. 12 Connect the red alligator clip of the Voltage Sensor in Analog Channel B to the component spring at the top end of the 1 kΩ resistor, and the black clip to the component spring at the bottom end.
AC/DC Electronics Laboratory 012-05892A Analyzing the Data ➀ Click on the Graph to make it active. Select “Save As…” from the File menu to save your data. • Because the Graph displays the voltage across the 1 kΩ resistor versus the voltage across the 22 kΩ resistor, the Graph is the output current or “collector” current (Ic) versus the input or “base” current (Ib). • The slope of the linear region of the plot gives the current gain of the transistor. ➁ Click on the “Statistics” button ( ).
012-05892A AC/DC Electronics Laboratory ➄ The “a2” coefficient of the Linear Fit line is the slope of the linear region. Record the value of the slope. • The slope can be interpreted as follows: slope = ∆Ic = β where β is called current gain of the transistor. ∆Ib ➅ Record the current gain of the 2N3904 transistor.
AC/DC Electronics Laboratory 012-05892A 100 ®
012-05892A AC/DC Electronics Laboratory Experiment #19: Transistor Lab 3 – Common-Emitter Amplifier EQUIPMENT NEEDED: – Computer and Science Workshop™ Interface – Power Amplifier (CI-6552A) – Voltage Sensor (CI-6503) – AC/DC Electronics Lab Board (EM-8656) – Regulated DC power supply of at least +5 Volts – Banana plug patch cords (such as SE-9750) Purpose The purpose of this experiment is to investigate the voltage and current amplification characteristics of the npn transistor in a common-emitter ampli
AC/DC Electronics Laboratory 012-05892A Section 1 Section 2 Section 3 Section 4 +5 V +5 V 2 kΩ red OUT 22 kΩ IN 1 kΩ 10 µF 1 µF red Power Amplifier To Channel A 22 kΩ black 10 kΩ Input coupling circuit Bias circuit black 1 kΩ Amplifier circuit Output coupling circuit Each section of the common-emitter amplifier circuit performs a specific function. In Section 1, the Input Coupling Circuit keeps DC voltages from changing the bias circuit.
012-05892A AC/DC Electronics Laboratory ➃ In the Physics Folder of the Science Workshop Experiment Library, open the document: Macintosh: “P56 Transistor Lab 3” / Windows: “P56_TRN3.SWS” The document opens with a Scope display of Analog Output voltage (V) and Analog Channel A voltage (V) versus Time (msec), and the Signal Generator window which controls the Power Amplifier. ➤ NOTE: For quick reference, see the Experiment Notes window.
AC/DC Electronics Laboratory 012-05892A Transistor 2N3904 E 3 VOLTS MAX C C W B 1 kΩ 1 kΩ +5V 10 µF 22 kΩ 10 kΩ 1 kΩ 22 kΩ to Power Supply 1 kΩ Ground 1 µF EM-8656 AC/DC ELECTRONICS LABORATORY to Power Amp to Channel A ➀ Insert the 2N3904 transistor into the socket on the AC/DC Electronics Lab Board. The transistor has a half-cylinder shape with one flat side. The socket has three holes labeled “E” (emitter), “B” (base) and “C” (collector).
012-05892A AC/DC Electronics Laboratory ➄ Connect one five inch wire lead from the component spring next to the emitter terminal of the transistor to the component spring at the top left corner of the component area of the AC/DC lab board. ➅ Connect one 1 kΩ resistor from the component spring at the top left corner of the component area and the component spring directly below.
AC/DC Electronics Laboratory 012-05892A ➤ NOTE: The negative end of the 10 µF capacitor has a slight bump. The positive end has an indentation around it. There is a band on the side of the capacitor with arrows that point to the negative end. 22 kΩ resistor Twist wires together. 10 µF capacitor > 20 21 > negative end Connect the wire from the positive end of the 10 µF capacitor to the component spring at one end of the wire lead connected to the collector terminal of the transistor.
012-05892A AC/DC Electronics Laboratory ➉ Turn off the power switch on the back of the power amplifier. Turn off the DC power supply. Voltage (peak) of OUT = ________ V Voltage (peak) of A = ________ V Analyzing the Data ➀ Use the values you recorded to calculate the ratio of input voltage (Voltage of OUT) to output voltage (Voltage of A).
AC/DC Electronics Laboratory 012-05892A 108 ®
012-05892A AC/DC Electronics Laboratory Experiment 20: Induction – Magnet Through a Coil EQUIPMENT NEEDED: – Computer and Science Workshop™ Interface – Voltage Sensor (CI-6503) – AC/DC Electronics Lab Board (EM-8656) – Alnico bar magnet (EM-8620) – OPTIONAL: Photogate (ME-9204A or ME-9498) Purpose This experiment shows the Electromotive Force (EMF) induced in a coil by a magnet dropping through the center of a coil.
AC/DC Electronics Laboratory 012-05892A ➂ In the Physics Folder of the Science Workshop Experiment Library, open the document: Macintosh: “P47 Induction-Magnet” / Windows: “P47_INDU.SWS” The document opens with a Graph display of Voltage (V) versus Time (sec). ➤ NOTE: For quick reference, see the Experiment Notes window. To bring a display to the top, click on its window or select the name of the display from the list at the end of the Display menu.
012-05892A AC/DC Electronics Laboratory ➤ NOTE: The bar magnet will be dropped through the coil. Make sure that the magnet does not strike the floor, or it may break. Part III: Data Recording ➀ Hold the magnet so that the south end is about 5 cm above the coil. If you are using the Alnico Bar Magnet (EM-8620) the South end is indicated by the narrow horizontal groove. ➁ Click the “REC” button ( ) and then quickly let the magnet drop through the coil.
AC/DC Electronics Laboratory 012-05892A Questions ➀ Is the incoming flux equal to the outgoing flux? ➁ Why is the outgoing peak higher than the incoming peak? ➂ Why are the peaks opposite in direction? Optional Repeat the data recording and data analysis procedures for the following: ➀ Tape two bar magnets together so both south ends are together. ➁ Rearrange the two bar magnets so that the south end of one is with the north end of the other. ➂ Try dropping the magnet from different heights.
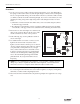
012-05892A AC/DC Electronics Laboratory Appendix: Tips and Troubleshooting Correct Circuit, Doesn’t Work • Check to see if the circuit is indeed connected correctly and completely. • Check to see if the battery is giving full voltage. • Check to see if each wire is making contact with the spring. If magnet wire is used, the enamel coating on the outside will prevent electrical connection and needs to be removed. In some cases, students may try to make a complete circuit through the insulation.
AC/DC Electronics Laboratory 012-05892A The Circuits Experiment Board can be used with a large variety of wire types and sizes. We recommend 20 or 22 gauge solid wire with colorful insulation. This will help students to follow their work more easily and minimize difficulties in making the transition from paper circuit to actual circuit on the Circuits Experiment Board.
012-05892A AC/DC Electronics Laboratory Teacher's Guide (Experiments 1-10) Exp 1 - Circuits Experiment Board ➀ ➁ Reversing things at either end had no effect. ➃➄ There are two different ways of putting two lamps into the circuit: parallel and serial. Parallel: With this method, the lights will each be approximately the same brightness as in part 1. Serial: Using this circuit, the lights will be dimmer than in part 1.
AC/DC Electronics Laboratory 012-05892A Exp 3- Ohm's Law Procedure ➁-➅)Warn the students to be particularly careful when setting up the multimeter to measure current. Attaching an ammeter the wrong way can damage the meter. Data Processing Resistance 100 560 330 1000 10 Current 0.02 0.00 0.00 0.00 0.14 Voltage 1.579 1.582 1.582 1.583 1.549 V/R % difference 0.02 -1.87% 0.00 -2.73% 0.00 -3.32% 0.00 -9.17% 0.15 -13.
012-05892A AC/DC Electronics Laboratory Colors A brown-black-brown-gold B orange-orange-brown-gold C green-blue-brown-gold coded 100 330 560 measured 98.9 330 561 % error -1.10% 0.00% 0.18% tolerance ±0.05% ±0.05% ±0.05% ➁-➃ Discussion In series, the resistances are added. R = R1 + R2 + R3 + ...In parallel, the reciprocals of the resistances are added. 1/R = 1/R1 + 1/R2 + 1/R3 +... This is evidenced in all the data sets above.
AC/DC Electronics Laboratory 012-05892A Exp 6- Currents in Circuits ➤NOTE: R1 = R2 = R3 = The resistors used were: Discussion 100Ω 330Ω 560Ω In any resistance circuit—series, parallel, or both—the voltage, current, and resistance are related by Ohm’s Law: These are the same resistors as were used in the previous lab, and some of the data here originates in lab 5. V = IR This pattern, and conclusion, should be apparent in student data.
012-05892A AC/DC Electronics Laboratory Analysis Second circuit: First circuit: ➀ node (2,3,4): ➀ node (1,3): -0.1 mA 0.1 mA node (b1,3,5): 0.1 mA node (1,2,5): 0.0 mA ➁ loop (b1,1,2,3) 0.001 V node (3,4,5): -0.1 mA loop (b2,5,3,4) 0.001 V node (2,4): 0.0 mA loop (b1,1,2,4,b2,5) 0.002 V ➁ loop (1,5,3): 0.001 V loop (1,2,4,3): 0.001 V loop (5,2,4): 0.000 V loop (batt,1,2): 0.001 V loop (batt,3,4): 0.000 V loop (batt,1,5,4): 0.001 V loop (batt,3,5,2): 0.
AC/DC Electronics Laboratory 012-05892A Exp 9- Diodes Analysis The diode acts as a one-way valve for electricity. Current can flow in one direction, but not in the other. Extensions ➀ A zener diode would be similar to the 4007, except that there would be a breakdown point on the reverse biasing, beyond which the current would flow. This makes them useful for power regulation. ➁) The LED opens up at a higher voltage than the 4007 (and it lights up).
012-05892A AC/DC Electronics Laboratory Technical Support Feed-Back Contacting Technical Support If you have any comments about this product or this manual please let us know. If you have any suggestions on alternate experiments or find a problem in the manual please tell us. PASCO appreciates any customer feedback. Your input helps us evaluate and improve our product.