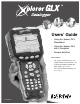
Users’ Guide • Using the Xplorer GLX Standalone • Using the Xplorer GLX with a Computer • Sample Activities New Features: • File storage on USB flash drive, p. 83 • Update firmware from flash drive, p. 93 • Instant data monitoring in Digits and Meter displays, pp. 37 & 38 • Voice and Text Data Annotation, p.
ii About this Guide The Xplorer GLX Users’ Guide is divided into two parts. Part 1 contains detailed information about operating the GLX, including descriptions of every screen, window and menu within the GLX environment, and instructions for common procedures. Part 2 contains step-by-step instructions for science activities and experiments that can be done with the GLX, its standard included equipment, and commonly available supplies. This is revision F of the User’s Guide, for version 1.
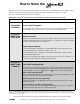
How to Store the ä Even when the screen is blank, the GLX is active: it powers its memory, it periodically checks its battery, and it monitors its keypad. Like other hand-held computers, the GLX never turns off—it just goes to sleep. Before you put your GLX away, read these instructions. With proper care, you can ensure that your GLX will be ready for use whenever you need it.
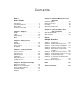
Con t en ts Part 1: Users’ Guide Introduction . . . . . . . Included Equipment Quick Start ....... Overview of the GLX ...... ...... ...... ...... ....... ....... ....... ....... ... ... ... ... 3 4 5 6 Chapter 1: Displays Graph . . . . . . . . . . . . . . . . . . . . . . . . . . Table . . . . . . . . . . . . . . . . . . . . . . . . . . . Digits Display .................... Meter . . . . . . . . . . . . . . . . . . . . . . . . . . . 13 28 37 38 Chapter 2: Utility Screens Output . . . . . . . . . . .
Part 1: U s e r s ’ G ui d e
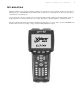
X p l o r e r G L X U s e r s ’ G u i d e 3 Int r oduc tio n The Xplorer GLX is a data collection, graphing, and analysis tool designed for science students and educators. The Xplorer GLX supports up to four PASPORT sensors simultaneously, in addition to two temperature probes and a voltage probe connected directly to specialized ports. An optional mouse, keyboard, or printer can be connected to the Xplorer GLX’s USB ports.
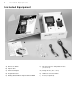
4 I n c l u d e d E q u i p m e n t Inc lud ed E qui pmen t A C B D E A) GLX Users’ Guide B) Xplorer GLX F G F) Two Fast-response Temperature Probes (-10 to 70 °C) C) AC Power Adapter G) Voltage Probe (-10 to +10 V) D) Registration Card H) USB Host-connection Cable E) Getting Started with the Xplorer GLX CD-ROM I) Poster (not pictured) H
X p l o r e r G L X U s e r s ’ G u i d e 5 Quick Start Getting started with the GLX is easy—simply plug in the AC adapter, connect one of the included sensors, and collect data. In the example below, you will start the GLX and collect temperature data. 1. Plug In the AC Adapter Connect the AC adapter to the power port on the right side of the GLX and plug the adapter into a power outlet (100 to 240 VAC, depending on your location). When you connect the AC adapter, the GLX turns on automatically.
6 O v e r v i e w o f t h e To stop data recording, press G L X again. You have just collected and graphed a run of temperature data. To collect additional data runs, press again. There are several different ways to collect data with the GLX. This is the simplest and most common. See “F1 Mode” on page 57 for other options. You can find a complete description of the Graph display starting on page 13. Over view o f the GLX The example above represents just a small part of the GLX’s capabilities.
X p l o r e r G L X U s e r s ’ G u i d e 7 the GLX. Do not connect a voltage source until after the probe is connected to the GLX; remove any voltage sources before disconnecting the probe. Sound Sensor To configure the GLX’s microphone as a sound sensor, press and F4 together to enter the Sensors screen; then press F3 to open the Microphone menu. From the menu, select Sound Sensor to record the sound waveforms, or select Sound Level to measure sound level in decibels.
8 O v e r v i e w o f t h e G L X Auto Power Off Timed Auto Power Off If it is running on battery power, the GLX will automatically save your data and shut down after a certain amount of continuous idle time (5 minutes by default).3 To set the idle time that must elapse before auto shut down on battery power, see “Auto Power Off” on page 85. If the GLX is running on AC power and the battery is fully charged, it will automatically shut down after 60 minutes of idle time.
X p l o r e r recording, you must press and hold recording will stop when you release G L X U s e r s ’ G u i d e 9 until you hear three beeps again. Data . Alternative Recording Modes If you have put the GLX into Manual Sampling mode (see page 57), it will not start recording when you press ; rather it will stand by to record a data point whenever you press .
10 O v e r v i e w o f t h e G L X Digits This screen is useful for displaying live data as they are collected from sensors and calculations. Up to six data sources can be displayed simultaneously. See page 37 for more information. Meter This display simulates an analog meter with a needle that deflects in proportion to a measurement made by a sensor. See page 38 for more information. Stopwatch With this screen, the GLX can be used like a regular stopwatch to time events.
X p l o r e r G L X U s e r s ’ G u i d e Top Bar The Top Bar is the part of the Home Screen that is always visible from anywhere in the GLX environment. It shows the time and date and the name of the GLX or the name of the open file. It also indicates the recording status, battery level and memory usage.
12 O v e r v i e w o f t h e G L X
X p l o r e r G L X U s e r s ’ G u i d e Cha p te r 1 : Disp lays The GLX has four screens for displaying data: Graph, Table, Digits, and Meter. This chapter will describe the structure and use of each display. Open any of the displays to monitor live data as it is collected. Open the Graph or Table to view previously recorded measurements or manually entered data. Grap h The Graph plots data on a pair of axes. Use the Graph to view, compare, and analyze data sets.
14 G r a p h Active Fields Run Number Units Data Source Data Source Units Active fields of the Graph Active fields are the areas on the Graph (and other display screens) through which you control what data are shown. When you select an active field, a menu opens containing choices of data source, units, or run number. Follow the steps below to select an active field using the keypad. 1. Press to “light up” the active fields—shaded boxes appear around the active fields. 2.
X p l o r e r G L X U s e r s ’ G u i d e 15 Choosing Data to Display Data Source A graph is generated from two data sources: one on the vertical axis and one on the horizontal axis. The possible types of data source are • a sensor measurement, • time (horizontal axis only), • a calculation, • manually entered numeric data, and • manually entered text data (horizontal axis only).1 If you configure the Graph with data sources that already contain data, the data will appear immediately.
16 G r a p h In normal mode, one data set is displayed at a time. See “Two Runs” on page 24 for instructions on displaying two runs simultaneously. The next-to-last option in the run number menu is Delete Run, which deletes the currently displayed run. That run will be deleted from all measurements, not just the one displayed in the Graph. The last option in the run number menu is Rename Run. By default, data runs are names “Run #1,” “Run #2,” etc.
X p l o r e r In Scale mode, the left and right arrow keys compress and stretch the Graph horizontally; the up and down arrow keys stretch and compress the Graph vertically. In Move mode, the arrow keys make the graph move left, right, up, and down. To return to normal mode (indicated when the F2 function reads “Scale/ Move”), press Esc . If the Graph is in Scale or Move mode and the arrow keys are not pressed for several seconds, the Graph will return to normal mode automatically.
18 G r a p h When you select a tool from the Tools menu,3 a check mark ( ) appears next to it. To turn off a tool, select it from the menu again, which removes the check mark and returns the Graph to normal mode. If you have a tool turned on and you choose a different tool, the previous tool will automatically turn off. 3 To select a tool from the Tools menu: Keypad 1. Press F3 to open the Tools menu. 2.
X p l o r e r G L X U s e r s ’ G u i d e 19 Negative DX and DY Positive DX and DY When the cursors swap places, the signs of ∆X and ∆Y change Slope Tool Select the Slope Tool from the Tools menu to measure the slope of a tangent line at one point on the data plot. A pair of crosshairs marks the point at which the slope is measured. Labels on the Graph’s edges show the coordinates of the point, and the slope is displayed at the bottom of the screen.
20 G r a p h When the Linear Fit is turned on, the special option Create Calculation from Linear Fit appears in the Tools menu (see page 22). Linear Fit can be useful even when the graphed data are not linear (quadratic or exponential, for instance). See “Graph Linearization” on page 47. Area Tool Select the Area Tool from the Tools menu to measure the area between the data plot and the X-axis in the ROI. (See “Statistics” above for instructions on setting the ROI.
X p l o r e r G L X The Trigger affects data recording even if you are not viewing the Graph. If you have set up two or more triggers on separate Graph pages,6 data recording will start when the most recently set trigger condition is met. Trigger Settings When the Trigger is turned on, you can open the Trigger Settings dialog box by pressing the left arrow key (you can also select it from the Tools menu).
22 G r a p h and other tools are applied. In cases where the two data sets are scaled separately, the active that is scaled. To toggle data without opening the menu: hold keys. Esc , press , and release both Esc + Toggle Data Shortcut Create Calculation from Linear Fit This option appears in the Tools menu when the Linear Fit (see page 19) is turned on. Select this option to automatically create an equation in the calculator based on the slope and y-intercept of the currently display best-fit line.
X p l o r e r G L X U s e r s ’ G u i d e 23 After you press , the GLX begins collecting and displaying a series of data bursts (each burst is enough data fill the Graph from left to right). If you have enabled the Trigger, the GLX waits for the trigger condition to be met before collecting each burst. While Scope-mode data collection is in progress, you can change the scale of the Graph (with F1 Autoscale, F2 Scale/Move, or the mouse) and you can change the Trigger settings with the arrow keys.
24 G r a p h Typically you would use Two Measurements mode to display data from two different sources, but you can also use it to display two runs from the same source. Select the same source from both data source fields, and different runs from each run number field. For another way to display two runs from the same source, see “Two Runs” below. Two Runs Select Two Runs from the Graphs menu to display two data sets from a single data source. In this mode, a second run appears on the Graph.
X p l o r e r G L X U s e r s ’ G u i d e 25 Print If there is a printer connected to the GLX, select Print from the Graphs menu to print the currently displayed graph page. Print All Select Print All to print all of the graph pages. For more information, see “Printing” on page 91. Delete Graph Page This option is available when two or more graph pages exist. When you select Delete Graph Page from the Graphs menu, the currently displayed page is deleted and the next page appears.
26 G r a p h A note with the Data Cursor positioned on it To make the Data Cursor jump directly to a note, hold Esc and press one of the arrow keys. Press Esc plus the left or right arrow key to make the cursor jump to the next visible note in either direction; press Esc plus the up or down arrow key to make the cursor jump to the first or last visible note. When the cursor lands on a note, the audio portion (if any) starts playing16 and the text portion of the note (if any) appears.
X p l o r e r G L X U s e r s ’ G u i d e 27 Note Editor Dialog Box Text Portion Audio Portion Audio Duration Audio Size F1 F2 F3 F4 Note Editor Dialog Box The Note Editor opens when you select Edit Note from the Annotation menu. The text portion of the note appears in the upper half of the box. Use the GLX’s keypad (or an attached USB keyboard) to enter new text or edit existing text.18 Press F4 to open the Text menu, which contains options related to entering and editing text.
28 T a b l e Table Use the Table to display data, edit or enter data manually, and display statistics on data sets. The Table can show up to four columns of numeric or text data. To Open the Table From the Home Screen, do one of the following: press F2 , the function key below the Table icon; use the arrow keys to highlight the Table icon, then press ; or The Table icon on the Home Screen click the Table icon.
X p l o r e r G L X U s e r s ’ G u i d e 29 If the chosen data source does not contain data, the data source name will appear at the top of the column, but the cells of the column will remain empty until data collection starts. Also from the data source menu, you can select Properties to edit the name and other properties of the currently displayed data set. See “Data Properties” on page 69 for more information.
30 T a b l e The chosen statistics will be displayed at the bottom of every column. To choose a statistic, select it from the menu.22 To turn off a displayed statistic, select it again. Select Show All or Hide All to turn on or off all of the statistics. 22To select a statistic from the Statistics menu: Keypad 1. Press F1 to open the Statistics menu. 2. Use the arrow keys to move the highlight to the desired statistic and press ; or press the number on the keypad corresponding to the desired statistic.
X p l o r e r G L X U s e r s ’ G u i d e 31 F4 Tables F4 Tables Menu From the Tables menu, you can select to display one, two, three, or four columns.24 If you increase the number of columns, new columns are added to the right side (the GLX automatically selects data sources, if available, for new columns). If you decrease the number of columns, they will be removed from the right side (the data displayed in those columns disappears, but is not be permanently deleted).
32 T a b l e of one column will cause all of them to change.26 To turn Lock Run Selection off or on, select it from the Tables menu. Export All Data If you have a USB storage device27 (such as a USB flash drive), you can use this option to export data in tab-delimited text format. The GLX creates a text file on the storage device that you can open on a computer in a spreadsheet, mapping software, DataStudio, and other programs. See page 83 for other ways to save and open data on a USB storage device.
X p l o r e r G L X U s e r s ’ G u i d e Entering Numeric Data In a New Column In the new editable column, you will see a box around the first cell and a blinking cursor inside the cell. 1. Type a number on the keypad (or attached keyboard), then press When editing data in the Table, = has the same effect as . The box and cursor will step to the next cell in the column. Enter another value and repeat. 3. When you are finished, press value before you press Esc .) .
34 T a b l e Naming Manually Entered Data and Adding Units By default, new editable data sets are named “Data 1,” “Data 2,” etc., and they do not have defined units. To change the name and add units, open the data source menu and select Data Properties.31 For more information, see “Data Source” on page 28, and “Data Properties” on page 69. Editing an Existing Data Set The above section, “Entering a New Data Set” starting on page 32, describes how to create and enter data in a new column.
X p l o r e r G L X U s e r s ’ G u i d e 35 Use the arrow keys to move the Navigating Box Position the Navigating Box on a cell where you would like to enter or edit data, then press F2 to make the Editing Box appear. To restore the Navigating Box, press Esc . If you would like to add data to the bottom of a data set, position the Navigating Box on the first empty cell below the existing data and press F2 .
36 T a b l e Graphing Manually Entered Data Numeric Data After you have created an editable numeric data set in the Table, you can display it in the Graph. In the Graph, select the editable data from the horizontal or vertical data source menu (see page 15). Text Data A text data set can be displayed on the horizontal axis of the Graph. First select a numeric data as the vertical data source, then select the text data as the horizontal data source (see page 15).
X p l o r e r G L X U s e r s ’ G u i d e 37 Di gits D isp lay Use the Digits display to show data from up to eight data sources. This display monitors and shows live data even when the GLX is not recording. Data Source Units Digits display To Open the Digits Display From the Home Screen, do one of the following: use the arrow keys to highlight the Digits icon, then press ; or click the Digits icon.
38 M e t e r Mete r The Meter display simulates an analog meter with a needle that deflects in proportion to a sensor measurement or sensor-based calculation. This display monitors and shows live data even when the GLX is not recording. Data Source Units Meter display To Open the Meter Display From the Home Screen, do one of the following: use the arrow keys to highlight the Meter icon, then press ; or click the Meter icon.
X p l o r e r G L X U s e r s ’ G u i d e 39 Cha p te r 2 : Utility Scr ee ns This chapter describes the Output screen, Calculator, Notes screen, and Stopwatch. O utp ut The Output screen is the control panel for generating sound through the GLX’s built-in speaker or through headphones or amplified stereo speakers connected to the signal output port.
40 O u t p u t Output Settings1 1The Output Device Highlight the Output control and press are using. to select the output device that you output settings in the Output screen can also be changed in the Audio Settings dialog box, accessed from the Settings screen (see page 87). When you change the settings in one location, they are automatically updated in the other location. Headphones Select this option to play sound through headphones connected to the signal output port on the left side of the GLX.
X p l o r e r G L X U s e r s ’ G u i d e 41 Ca lcul ato r You can use the GLX Calculator like a regular calculator for finding the result of a simple expression, like a graphing calculator for plotting equations, and for performing operations, in real time, on streams of data collected from sensors and on sets of manually entered data.
42 C a l c u l a t o r • Press the up arrow key to put the cursor back on the above expression and modify it to read: 9 * (9 + 3) When you type something into the middle of an existing expression, the new characters are inserted without overwriting anything; press Õ to delete the characters that you don’t want. Note that the correct result does not appear until you have moved the cursor to a different line by pressing = or , or the up or down arrow key.
X p l o r e r G L X U s e r s ’ G u i d e 43 When there is more than one definition for the same symbol, the calculator uses the first definition. To avoid confusion, do not define a symbol more than once. If you want to change the value of a symbol, use the arrow keys to go back to the original definition and change it. Do not do this • When you are prompted for the value of a symbol, you can enter another expression rather than a simple number.
44 C a l c u l a t o r • A symbol does not have to be a single letter. The Calculator will recognize any text string (without spaces) as a symbol, including text strings that contain numerals. (To type text on the keypad, see “Num Lock” on page 50.) Examples of text strings used as symbols in algebraic calculations Graphing Equations If you enter an equation that contains one undefined variable to the right of the equal sign, the GLX can graph it.
X p l o r e r G L X U s e r s ’ G u i d e See “Data Source” on page 15 for more information about selecting data in the Graph. In the Graph, select the calculation from the data source menu • You don’t have to use x as the undefined variable; whichever symbol you leave undefined on the right side of the equation will be plotted on the horizontal axis. However, the label on the horizontal axis will always read “x,” even if the variable used in the calculation is not x.
46 C a l c u l a t o r • Open the calculator. On the first blank line, enter:9 d = [Temperature (°C)] - 20 Instead of typing “[Temperature (°C)]”, select it from the [Data] menu.10 F2 Open the [Data] menu; select Temperature and °C • Press the up arrow key to place the cursor on the calculation. Press F3 to view the calculation on the preview graph. Note how the calculated data differs from the original temperature data. • Press + F1 to open the full-screen Graph.
X p l o r e r G L X U s e r s ’ G u i d e 47 Plot the calculation on the horizontal axis in place of Time to create the graph shown below. (See page 28 for instructions on selecting data for the horizontal axis.) Convert Units of Measure Most of the sensors used with the GLX are programmed with SI units (or the International System of Units) and, in some cases, other common units.
48 C a l c u l a t o r • The position versus time graph of an object in free fall (below right) exhibits a typical quadratic relationship. The object was dropped from a height of 0.79 m, with the release occurring 2.2 s after the start of data collection. The graph can be linearized (as shown below right) by replacing Time on the horizontal axis with the calculation ([Time (s)]-2.2)^2. The slope of the best-fit line is a ⁄ 2 , where a is the acceleration of the object. Position vs.
X p l o r e r G L X U s e r s ’ G u i d e 49 Special functions, output-control functions, and logic operators and functions are typically used to control the GLX’s digital and audio output. See “Outputcontrol Calculations” on page 50 for detailed explanations of these functions and operators. Inserting a Function When you select an item from one of the Functions menus, it is inserted at the cursor location.12 If the item includes a pair of parentheses, the cursor will be positioned between them.
50 C a l c u l a t o r F4 Edit Menu Press F4 (or click Edit) to open the Edit menu, which contains the options described below. Num Lock When Num Lock is on (which it is by default), an icon ( ) appears in the lower right corner of the screen. Edit menu Num Lock Icon To turn Num Lock on or off, select Num Lock from the Edit menu.14 14 With Num Lock on, you can type only numerals (not letters or punctuation marks) with the keypad. Multiple presses of a key will not cycle through multiple characters.
X p l o r e r G L X U s e r s ’ G u i d e 51 Special Functions These special functions do not directly control output, but can be useful in combination with the output-control functions. limit(min, max, x) The limit function is used keep a varying value within a specified range. The function has three arguments: min, max, and x. • If x < min, then limit(min, max, x) = min. • If x > max, then limit(min, max, x) = max. • If min ≤ x ≤max, then limit(min, max, x) = x.
52 C a l c u l a t o r outputfreq(Channel, frequency) Use the outputfreq function to set the frequency of the audio output signal.18 The first argument, Channel, can equal 1 (for left) or 2 (for right) and identifies which channel is to be controlled. The second argument, frequency, sets the frequency, in Hz, of the output signal. The frequency can be set between 250 and 5000 Hz for the built-in speaker, or between 60 and 5000 Hz for headphones or external speakers.
X p l o r e r G L X U s e r s ’ G u i d e 53 No tes Sc ree n Use the Notes screen to record experiment instructions, information about the sensors and displays that you have set up, notes on recorded data, or any other text information. To Open the Notes screen From the Home Screen, do one of the following: use the arrow keys to highlight the Notes icon, then press ; or click the Notes icon.
54 S t o p w a t c h Sto pw at ch With the Stopwatch screen, you can use the GLX like a conventional stopwatch. To Open the Stopwatch From the Home Screen, do one of the following: use the arrow keys to highlight the Stopwatch icon, then press ; or click the Stopwatch icon. The Stopwatch icon on the Home Screen Timing with the Stopwatch The numbers displayed on the stopwatch indicate elapsed time in minutes and seconds. minutes F1 Press F1 F2 to start timing.
X p l o r e r G L X U s e r s ’ G u i d e 55 Cha p te r 3 : Se t t ing s an d F il es Sen sor s S cr een In many cases, the sensor set-up process requires nothing more than simply plugging in a sensor. However, if you would like to change any of the sensor settings, or configure a sensor that you have not physically plugged in, or change the mode of data collection, go to the Sensors screen. Also use the Sensors Screen to configure the GLX’s microphone as a sound sensor.
56 S e n s o r s S c r e e n Sensor Settings To change any of the settings, use the arrow keys to highlight the settings and press . If you are using a mouse, click the desired setting. Sample Rate Unit Select Sample Rate Unit2 to choose how the sampling rate will be measured. The choices are samples per second; or seconds, minutes, or hours (time between samples).
X p l o r e r G L X U s e r s ’ G u i d e 57 Zero Automatically On Start This setting appears for sensors that support zeroing (such as acceleration, rotary motion, and drop counter sensors). The three choices are “On,” “Off,” and “Zero Now.” When “On” is selected (which it is by default), the sensor measurement is adjusted with each new data run to make the first sample zero. When “Off” is selected, the measurement is not automatically zeroed.
58 S e n s o r s S c r e e n F3 Microphone The Microphone menu contains options for setting how the GLX uses its built-in microphone. The selected option is indicated by a check mark ( ) appearing next to it in the menu.7 7To select an option from the Microphone menu Keypad 1. Press F3 to open the menu. 2. Use the arrow keys to highlight the desired menu option and press ; or press the number on the keypad corresponding to the desired option. Mouse 1. Click Microphone to open the menu. 2.
X p l o r e r G L X U s e r s ’ G u i d e 59 F4 Sensors The Sensors menu contains the following options for adding, removing, and calibrating sensors.9 Add Select this option to set up a sensor without physically connecting it. A menu containing all PASPORT sensors will open. Use the arrow keys to highlight the desired sensor and press . Remove Use this option to delete the selected sensor without disconnecting it from the GLX. All data collected by that sensor will be deleted.
60 S e n s o r s S c r e e n Manual Sampling Mode In Manual Sampling mode, the GLX records a single sample from each measurement only when you trigger it by pressing . Follow these steps to set up Manual Sampling mode and record data. Set Up + F4 1. Press 2. Press 3. Use the arrow keys to highlight Manual and press F1 to go to the Sensors screen. to open the Mode menu. . The Data Properties dialog box appears. This box specifies the name and units of the (optional) manually entered data.
X p l o r e r 2. Press . The GLX starts measuring, but not recording. A blinking flag icon ( ) appears in the upper right-hand corner. Another flag icon appears at the left side of the first table row. 3. Press the right arrow key. Notice that the flag icon moves to first cell of one column. If there is another column displaying collected data (not manually entered) press the right arrow again to move the icon to that column. This icon indicates which cell will collect data when you press .
62 T i m i n g S c r e e n Timi ng S cr een Use the Timing screen to set up measurements made with photogates, Smart Pulleys and other switch- or counting-type sensors. The Timing Screen To Open the Timing Screen The Timing screen usually launches automatically when you connect a switch- or counting-type digital sensor to the GLX through a Photogate Port or a Digital Adapter.13 13Photogate Port is PASCO part PS-2123A. Digital Adapter is PASCO part PS-2159.
X p l o r e r measured from the start of data collection to the midpoint of the sequence. From these measurements and user-entered (or default) constants, the GLX derives other measurements such as position, velocity, and acceleration. The configuration of what sequences the GLX measures and what secondary measurements it derives is called a timer.14 The GLX is programmed with nine timers.
64 T i m i n g S c r e e n 4. Set Time in Gate and Velocity in Gate to “Visible.” 5. Pretend that you have a cart with a 5 cm flag on it; set the Flag Length constant to 0.05 m. (Highlight Flag Length and press , then type 0.05.) 6. In this case, photogate spacing is irrelevant, so leave the Photogate Spacing field blank.
X p l o r e r G L X U s e r s ’ G u i d e 65 Position equal to the Band Spacing. Velocity and Acceleration are calculated based on the time intervals between the changes in Position. Picket fences include PASCO parts ME-9377A and ME-9804. Photogate tape is included with parts ME-6664 and ME-6666. Smart Pulley (Linear) Use this timer for measuring linear motion with a Smart Pulley (or a combination of photogate and pulley).
66 T i m i n g S c r e e n Time of Flight Use this timer with a projectile launcher, two photogates, and a Time-of-Flight Accessory.20 The constant, Photogate Spacing, is the distance (in meters) between the centers of the photogates. The measurements are Initial Velocity and Time Of Flight. • Initial Velocity is the Photogate Spacing divided by the time-between-gates.
X p l o r e r G L X U s e r s ’ G u i d e 67 If both carts are traveling in the same direction before the collision, one photogate will measure the initial velocity of both carts. Similarly, if both carts are traveling in the same direction after the collision, one photogate will measure both final velocities. If one of the carts is stationary before the collision, its initial position will be between the photogates, and its initial velocity will not be measured.
68 T i m i n g S c r e e n GLX. The Add menu will open automatically; select Relay Control.22 Both ports of the adapter will be configured for Relay Control (though they are controlled separately), so you can connect a second relay to the adapter with no additional set-up required. You can connect up to four Digital Adapters, each with two ports, for up to eight separately controlled output channels. See page 51 for information about controlling digital output through the Calculator.
X p l o r e r G L X U s e r s ’ G u i d e 69 Da ta P r oper t ies F1 F2 Data Properties dialog box Every data set and data source in the GLX has data properties, which control how the data are displayed in the Graph, Table, and other screens. To Open the Data Properties Dialog Box To access and edit the properties of a data source, set up the Graph or Table to display the data source, then open the data source menu and select Properties.26 The Data Properties dialog box will open.
70 D a t a P r o p e r t i e s See “Multipress Text Input Mode” on page 90 for instructions on using the keypad to enter text. Note that changing the name of the units will have no effect on the actual data. For instance, if you change the name of the Temperature units from “°C” to “°F,” the numeric values of displayed temperature will not change.
X p l o r e r G L X U s e r s ’ G u i d e Ca lib rat ion Some of the sensors that you use with the GLX can be calibrated in the Calibration dialog box, which is accessible through the Sensors screen. Calibration can make a measurement more accurate or adjust multiple measurements so that they agree with each other. Sensors designed for calibration include the temperature probes included with the GLX. Certain other PASPORT sensors are also calibratable.
72 C a l i b r a t i o n Input Data Pt 2 DInput Pt 1 Slope = DOutput DInput DOutput Offset Output Data Two points, Pt 1 and Pt 2, define the line. In the two-point calibration procedure, each point is reset by associating a known standard value (for instance, the pH of a buffer solution) with a raw input measurement that the sensor sends to the GLX when it is in that standard. In a one-point calibration, only one of the points is reset by the user.
X p l o r e r G L X U s e r s ’ Input Data One-Point Offset In a one-point offset calibration, you reset only one point. The line shifts so that it intersects the new point, but its slope does not change. new calibration new point old calibration line shifts Output Data One-point slope calibration; the line shifts to intersect the new point Offset calibration is usually used to make one sensor agree with another sensor.
74 C a l i b r a t i o n Sensor Field Measurement Field Single/All Field Calibration Type Arrow indicating that additional fields can be displayed with the down arrow key Pt 1 Standard Value Pt 1 Sensor Input Value Pt 2 Standard Value Pt 2 Sensor Input Value Arrow indicating that additional fields can be displayed with the up arrow key The top and bottom portions of the Calibration dialog box Sensor Field Highlight this field and press + or calibratable sensors connected to the GLX.
X p l o r e r G L X U s e r s ’ G u i d e 75 Because they are not needed, the fields for Pt 1 are hidden when the 1 Point Slope calibration type is selected, and the fields for Pt 2 are hidden when the 1 Point Offset calibration type is selected. Calibrated Output and Raw Input Two live values are displayed at the bottom of the Calibration dialog box: the Calibrated Output Measurement and the Raw Input Measurement. The Raw Input Measurement is the data transferred from the sensor to the GLX.
76 C a l i b r a t i o n 8. Press F3 to read the sensor input value of Pt 1. Note that the Raw Input Measurement has been automatically entered into the Pt 1 Sensor Input Value field, and the standard value is now displayed as the Calibrated Output Measurement. 9. Place the probe in the second known standard. 10. Enter the value of the standard in the Standard Value field for Pt 2. 11.
X p l o r e r 6. Enter the value of the standard in the Standard Value field for Pt 2. 7. Observe the Raw Input Measurement displayed near the bottom right corner of the screen and wait until it has stabilized. 8. Press F4 G L X U s e r s ’ G u i d e 77 Enter standard value here to read the sensor input value. Note that the Raw Input Measurement has been automatically entered into the Pt 2 Sensor Input Value field, and the standard value is now displayed as the Calibrated Output Measurement.
78 D a t a F i l e s S c r e e n Da ta F ile s S cre en Collected data, calculations, notes, display configurations, and sensor settings are all stored in the GLX’s memory. You can save data in a file during or after an experiment, or save a file without data to use as the starting point of an experiment. Use the Data Files screen to view, create, copy, move, and delete these files and their components.
X p l o r e r G L X U s e r s ’ G u i d e For more information on the RAM and Flash data-storage locations, see page 82. Navigating in the File List When the focus is on the File List, a highlight appears on one of the entries. Press the up and down arrow keys to move the highlight. Selected folder The entries in the File List consist of: The Active File This is the open file that you are currently working with. It always appears as the first entry in the RAM file list.
80 D a t a F i l e s S c r e e n Mouse Navigation If you are using a mouse, click RAM or Flash to view the File List for each folder. Click the file or file component to highlight it. Click the icon to the left of a file to show or hide the file contents. Data Files Function Keys F1 Open To open a saved file, highlight it in the File List and press F1 (or click Open). If changes have been made to the current active file since it was last saved, a dialog box will ask if you want to save the file.
X p l o r e r G L X U s e r s ’ G u i d e 81 If changes have been made to the current active file since it was last saved, a dialog box will ask if you want to save the file. Select Yes ( F1 ) to save the current active file before it is unloaded. Select No ( F2 ) to unload the file without saving it; any changes you have made since it was last saved will be lost. Select cancel ( F3 ) to keep the current active file open and not create a new file.
82 D a t a F i l e s S c r e e n RAM and Flash The GLX has two types of memory for file storage: RAM and Flash, represented by two folders in the Data Files screen. By default, files are saved in the RAM folder. Whether it is most appropriate to store a file in RAM or Flash depends on how you intend to use the file. Files in the RAM folder are saved in the GLX’s random access memory.
X p l o r e r G L X U s e r s ’ G u i d e 83 Using the GLX with a USB Storage Device If you have a USB storage device34 (such as a USB flash drive), you can use it to add storage capacity to your GLX, back up data, and transfer data to another GLX or a computer. See also “Export All Data” on page 32 for instructions on exporting data as a tab-delimited text file to USB storage. Connect a storage device to the larger USB socket (labeled with side of the GLX.
84 D a t a F i l e s S c r e e n GLX-to-GLX File Transfer To transfer files directly between two GLXs, connect the larger USB port of one GLX to the smaller USB port of the other GLX using the included USB hostconnection cable. Host GLX Remote GLX Use the host-connection cable to connect two GLXs The GLX connected by the larger USB port is the host unit, and the one connected by the smaller port is the remote unit.
X p l o r e r G L X U s e r s ’ G u i d e 85 Set ti ngs Scr ee n F1 F4 F2 Settings screen The Settings screen contains the controls for how the GLX environment looks and acts. To Open the Settings Screen From the Home Screen, do one of the following: use the arrow keys to highlight the Settings icon, then press ; or click the Settings icon. The Settings icon on the Home Screen Settings To change any of the settings, use the arrow keys to highlight the setting and press .
86 S e t t i n g s S c r e e n Back Light From anywhere in the GLX environment, the easiest way to turn the screen’s back light on or off is to hold and press . You can also operate the back light from the Settings screen. Highlight Back Light and press to open the menu. Use the arrow keys to highlight the desired menu option and press or press the number on the keypad corresponding to the desired menu option.
X p l o r e r G L X U s e r s ’ G u i d e 87 Settings Screen Function Keys F1 Set Date and Time The date and time are set automatically when you connect the GLX to a computer running DataStudio. Follow these steps to set the date and time manually. 1. Press F1 . A dialog box will open with settings for Month, Day, Year, Hour, Minute, and Second. 2. Use the up and down arrow keys to highlight the setting you would like to change. F1 3.
88 S e t t i n g s S c r e e n
X p l o r e r G L X U s e r s ’ Cha p te r 4 : Na vi ga t ion an d I n pu t Da ta S ou rce M enu s The axes of the Graph, the columns of the Table, the sections of the Digits display, and the Meter each have a data source field, which you access to choose what data to display. Selecting any of these data source fields opens a data source menu containing a list of all available data sources.
90 M u l t i p r e s s T e x t I n p u t M o d e Accessing Data Properties Selecting the Data Properties option from a data source menu opens the Data Properties dialog box for the selected measurement. In this example, the Data Properties for Relative Pressure would open. To access the Data Properties of another measurement, first select that measurement from the data source menu, then open the menu again and select Data Properties. For information on the Data Properties dialog box, see page 69.
X p l o r e r G L X U s e r s ’ G u i d e 91 Sci ent if ic N otati on The GLX displays very large and very small numbers using scientific notation. You can also input any number using scientific notation. On the GLX, the letter E, when it is placed between two numbers (with no spaces) is interpreted as meaning “times 10 raised to the power of….” The letter E can always be input by pressing the decimal point key ( even when the GLX is not in multipress text input mode.
92 P r i n t i n g
X p l o r e r G L X U s e r s ’ G u i d e 93 Cha p te r 5 : Ha rdw are Ma int e na nc e an d O pe ra ti on Fir mw ar e U pd ate From time to time, PASCO issues a free update to the firmware that runs on the GLX. Updates include new and improved features and bug fixes. Send in the registration card that you received with your GLX, or register at www.pasco.com/glx to be notified of new updates.
94 B a t t e r y a n d P o w e r While charging, the GLX monitors its own temperature to prevent overheating. The maximum recommended ambient temperature for charging is 32 °C (90 °F) without sensors, or 28 °C (82 °F) with four maximum-load sensors4 connected. If the GLX becomes too hot, it will temporarily stop charging to allow itself to cool, resulting in a longer charge time.
X p l o r e r G L X U s e r s ’ G u i d e 95 Manual Internal Disconnection If you anticipate that your GLX will be left unused and unplugged for more than a month, manually put it into deep sleep mode. This will make it more likely that the battery will be charged the next time you use it. Follow these steps: 1. Leave the GLX plugged in until the battery is fully charged. 2. Unplug the AC Adapter. 3. Open the Settings screen (see page 85). F3 to open the Battery Set menu. Press F3 4.
96 R e s e t t i n g When the battery’s capacity begins to decrease, it will continue to function, but it will require more frequent recharging, and the maximum unpowered time for the GLX to store data in RAM will decrease. If this happens, try to recondition the battery by running it through three complete, uninterrupted charge-discharge cycles: Disconnect the AC adapter. Plug in a sensor. Start data collection and wait until the GLX shuts down due to low battery.
X p l o r e r 3. Connect the GLX to a computer running DataStudio to re-install sensor data sheets. Follow these steps to reset system settings to factory defaults and delete saved data in RAM and Flash. 1. Turn the GLX off then on again. 2. When the Splash Screen is visible, press the key sequence 3. Connect the GLX to a computer running DataStudio to re-install sensor data sheets. Esc - .
98 O p e r a t i n g T e m p e r a t u r e
X p l o r e r G L X U s e r s ’ G u i d e 99 Cha p te r 6 : Usin g t he Xp lo re r GL X with a Com pu t er The GLX can be connected to a computer1 to transfer files, to collect data using DataStudio software, and to install updates to the GLX. 1 Supported operating systems include Windows 98/2000/ME/XP, Mac OS 9, and Mac OS X. G LX w ith D a taSt udio 2 When used with a computer, the GLX requires DataStudio version 1.9.5 or later.
100 G L X w i t h D a t a S t u d i o Transferring Files GLX File Manager If DataStudio detects a GLX with new files saved on it, it automatically opens the GLX File Manager. You can also manually open the GLX File Manager with these steps. 1. Click the Setup button (in DataStudio’s main button bar). The Experiment Setup window will open. 2. In the Setup window, click the Manage Files icon. The GLX File Manager will open.
X p l o r e r G L X U s e r s ’ G u i d e to select a folder on your computer and a file name for the downloaded copy of the file. GLX files saved on your computer’s disk have the file extension .glx. They can be opened with DataStudio or copied to another GLX. Delete Click the Delete button to delete a file or files from the GLX. When a GLX folder is selected, the Delete button is labeled “Delete All.” Click the button to delete all of the files in the selected folder.
102 G L X w i t h D a t a S t u d i o DataStudio, the file is translated into a DataStudio file. Most components of the GLX file, listed below, appear in the new DataStudio file.
X p l o r e r G L X U s e r s ’ G u i d e 103 G LX Si mula tor When you install DataStudio version 1.9.5 (or later) on a Windows computer, a second piece of software, the GLX Simulator, is also installed. To start the simulator, run the executable file4 XplorerGLX.exe. The GLX Simulator behaves like a real GLX. To “press” keys on the Simulator keypad, click them with the computer’s mouse, or press the equivalent key on the computer’s keyboard. (See page 90 for keyboard equivalents.
104 G L X S i m u l a t o r Simulated data from the Virtual Motion Sensor Screen Capture Click the Copy Screen button to copy an image of the Simulator’s screen to the computer’s clipboard. The image can then be pasted into another application (such as a word processor) by selecting Paste from that application’s Edit menu. Screen Mirroring When a real GLX is connected to the computer, the Mirror GLX Screen option appears in the Simulator.
Part 2: Sample Activities The following pages contain step-by-step instructions for science activities and experiments that can be done with the GLX, its included temperature and voltage probes, and commonly available supplies; no PASPORT sensors are required.
X p l o r e r Activi ty 1 : Ca lor ime tr y Equipment Quantity Xplorer GLX 1 Fast-response Temperature Probes 2 20 g Brass Masses 3 Styrofoam Cups 3 String 1m Hot Water (50 to 70 °C) 500 ml Room-temperature Water 500 ml Background In this experiment, you will add a hot piece of metal to room-temperature water and measure the temperature change of the water. How does doubling the mass of the added metal affect the temperature change? Before You Begin Start a new experiment on the GLX. 1.
108 C a l o r i m e t r y GLX Set-Up 1. Connect the temperature probes.1 a) 1 Connect the probe in Cup 1 to one of the temperature ports on the left side of the GLX. Optional: after connecting the probes, perform the alignment calibration described on page 77. b) Connect the probe in Cup 2 to the other temperature port. c) 2. If there are other sensors connected to the GLX, remove them. Set up the Graph to display both temperatures versus time.
X p l o r e r 2. Create a new graph page showing only the temperature in Cup 2 versus time. a) Press Page. F4 to open the Graphs menu; press b) On the new graph page, press c) 3. 7?! to select New Graph twice to open the data source menu. Press the down arrow key to highlight Temperature2 and press . Use the Delta Tool to find the temperature change in Cup 2. a) Press Tool.
110 C a l o r i m e t r y
X p l o r e r G L X U s e r s ’ G u i d e 111 Activi ty 2 : Me lting Po in t De p ressi on Equipment Quantity Xplorer GLX 1 Fast-response Temperature Probes 2 Test Tubes 2 Test Tube Rack 1 Deionized Water 110 mL NaCl 1g Background How does the addition of salt affect the melting point of a solution? In this experiment, you will measure the temperature over time of frozen salt water and pure water as they melt.
112 M e l t i n g P o i n t D e p r e s s i o n Procedure 1. Remove the frozen solutions from the freezer. 2. Connect the temperature probes. a) Connect the temperature probe measuring the pure water ice to Temperature Port 1 on the left side of the GLX. b) Connect the other probe to Temperature Port 2. 3. Press 4. Set up the Graph to display both temperature measurements. a) to start data collection.
X p l o r e r G L X U s e r s ’ G u i d e 113 Ac t iv i ty 3 : He at Tra nsf e r by Ra di at io n Equipment Quantity Xplorer GLX 1 Fast-response Temperature Probes 2 Aluminum Can, Painted Black 1 Aluminum Can, Unpainted1 1 Hot Water (50 to 70 °C) 1Use empty beverage containers or PASCO part TD-8570A, which includes one black can and one unpainted can.
114 H e a t 2. T r a n s f e r b y R a d i a t i o n Set the sampling periods of both probes to 10 seconds. a) Press screen. F4 to return to the Home Screen; press Observe which sensor is selected to open the Sensors b) Observe the top part of the screen and note which sensor (“Temperature Sensor” or “Temperature Sensor 2”) is selected. c) With Sample Rate Unit highlighted, press 2 to select seconds.
X p l o r e r G L X U s e r s ’ G u i d e Activi ty 4 : Ne wto n ’s La w of Co oli ng Equipment Quantity Xplorer GLX 1 Fast-response Temperature Probes 2 Styrofoam Cups 2 Test Tube 1 Tape 10 cm Sand 100 g 500 mL Hot Water (50 to 70 °C) Background Newton’s Law of Cooling states that the rate of temperature change of a body is proportional to its relative temperature, r, or the body’s temperature minus the temperature of the surroundings.
116 N e w t o n ’ s L a w o f C o o l i n g Procedure Equipment Set-Up 1. 2. 3. Place the end of a fast-response temperature probe in the test tube, then fill the test tube about one-third full of sand, as pictured to the right. The probe should be embedded in the sand. Use tape to secure the probe. to the GLX tape Partially fill a cup with hot water (50 to 70 °C) and immerse the sand-filled portion of the test tube. Let the sand warm up for a few minutes while you set up the GLX.
X p l o r e r e) 4. Press F1 G L X U s e r s ’ G u i d e 117 to accept the changes and return to the Sensors screen. Connect the second sensor to the GLX. Connect the temperature probe that will measure the air temperature to Temperature Port 2 of the GLX. You will see the new icon appear in the upper part of the Sensors screen with a box around it. Icon for second temperature probe 5. F1 F2 Set the sample rate of the second sensor and rename the measurement.
118 N e w t o n ’ s L a w o f C o o l i n g Analysis Observe the graph of Object Temperature versus time and Air Temperature versus Time. If the experiment were allowed to run indefinitely, what would the relationship between object and air temperature eventually be? 1. Create a calculation for relative temperature. a) Press lator.
X p l o r e r 5. G L X U s e r s ’ G u i d e 119 Create a calculation for ln(r/r0) a) Press lator. to return to the Home Screen; press F3 to open the CalcuEnter this calculation Calculator will prompt you for value b) On a blank line, enter: ln(r/r0) c) To insert the ln() function, press F1 to open the Functions menu, use the arrow keys to highlight ln(), and press . F1 d) The Calculator will prompt you on the next line to enter the value of r0.
120 N e w t o n ’ s c) L a w o f C o o l i n g To insert the function e^, press F1 to open the Functions menu, use the arrow keys to highlight e^, and press . e^ parentheses Also open the Functions menu to select and insert the pair of parentheses. d) The Calculator will prompt you to enter the values of k and t. (It does not prompt you for r0 because you entered that constant in step 5.) 9. e) Enter the value of k that you found in step 7 and press .
X p l o r e r G L X U s e r s ’ G u i d e Act iv i ty 5 : Mic ro c lim at e Te mp er at u re Va ria ti on Equipment Quantity Xplorer GLX 1 Fast-response Temperature Probe 1 Background In this activity, you will measure and record the air temperature at different outdoor locations within a small area to investigate how ground cover and nearby objects affect air temperature. Before You Begin Start a new experiment on the GLX. 1. Press to go to the Home Screen. 2.
122 M i c r o c l i m a t e c) T e m p e r a t u r e V a r i a t i o n Press the down arrow key to highlight Manual and press . d) The Data Properties window will open with the Measurement Name set to “Keyboard Data.” Press F1 to accept this setting. 3. Press to return to the Home Screen; press F2 to open the Table. The Table will be automatically set up to display Temperature and Keyboard Data. F1 Data Collection 1. Press 2. Take the GLX to one of the locations marked on your map. 3.
X p l o r e r G L X U s e r s ’ G u i d e 123 Act iv i ty 6 : Vo lta ge v ersu s Res i s ta nc e Equipment Quantity Xplorer GLX 1 Voltage Probe 1 Resistors, 1000 Ω 5 Battery and Battery Holder (“AA,” “C,” “D,” or similar) 1 Short Alligator Clip Leads 6 Background F In this experiment, you will construct the circuit pictured to the right and measure the voltage (relative to the negative terminal of the battery) at points A through F.
124 V o l t a g e 2. v e r s u s R e s i s t a n c e Lay out the circuit on a piece of paper so you can label the parts of the circuit. Label points A through F and the positive and negative terminals of the battery. GLX Set-Up 1. Connect the voltage probe to the GLX. a) Connect the voltage probe to the voltage port on the left side of the GLX. b) If there are other sensors connected to the GLX, remove them. 2. Configure the GLX for manual sampling. a) Press screen.
X p l o r e r G L X U s e r s ’ Graph prepared to plot V vs. r Data Collection 1. Press . The GLX is now measuring voltage, but it is not recording data. 2. Connect the black lead of the voltage probe to the negative terminal of the battery. 3. Place the red lead of the probe in contact with the circuit at point A. 4. Press 5. The GLX will prompt you to enter r, the total resistance across which the voltage is measured. (For point A, r = 0.) Type the value of r and press F1 . 6.
126 V o l t a g e v e r s u s R e s i s t a n c e
X p l o r e r G L X U s e r s ’ G u i d e 127 Act iv i ty 7 : I nd uc e d E le c tr omo t ive F o rce Equipment Quantity Xplorer GLX 1 Voltage Probe 1 Coil1 1 Bar Magnet 1 1Use a coil with a few hundred turns, such as the one included with PASCO part CI-6512. Background When a permanent magnet passes through a coil, the changing magnetic flux induces and electromotive force (EMF) or voltage in the coil.
128 I n d u c e d E l e c t r o m o t i v e F o r c e GLX Set-Up 1. 2. Connect the voltage probe to the GLX. a) Connect the voltage probe to the voltage port on the left side of the GLX. b) If there are other sensors connected to the GLX, remove them. Set the sampling rate to 200 Hz. a) Press b) Press c) to return to the Home Screen. F4 to open the Sensors screen. Press the down arrow key to highlight Sample Rate. d) Press + repeatedly to set the Sample Rate to 200 Hz. 3.
X p l o r e r G L X U s e r s ’ G u i d e 129 b) Use the left and right arrow keys to move the right side of the dashed box to the right side of the first peak. c) Hold Esc and press dashed box. Õ to swap the cursor to the other side of the d) Use the left and right arrow keys to move the left side of the dashed box to the left side of the first peak. See page 20 for detailed instructions on using the Area Tool. Area under the first peak = _________________ (include sign and units) 3.
130 I n d u c e d E l e c t r o m o t i v e F o r c e
X p l o r e r G L X U s e r s ’ G u i d e 131 Act i v i ty 8 : C a pac i t o r D i s c h ar ge Equipment1 1 Quantity Xplorer GLX 1 Voltage Probe 1 Capacitor (between 0.015 and 1 F) 1 Resistor (between 100 and 1000 Ω) 1 Battery and battery holder (“AA,” “C,” “D,” or similar) 1 Alligator Clip Leads 4 Use separate electronic components or the PASCO EM-8678 Charge/Discharge board, which includes a capacitor, resistors, and battery holder.
132 C a p a c i t o r 4. D i s c h a r g e When the GLX asks if you would like to save the previous file, press to save or F2 not to save. F1 Procedure Equipment Set-Up + battery + C - R capacitor + - voltage probe resistor 1. Create the circuit pictured above. Note that the negative terminal of the battery is connected, but the positive terminal is not. The voltage probe is connected so that it will measure the voltage across the capacitor. 2.
X p l o r e r G L X U s e r s ’ G u i d e 133 Analysis From Equation 2, it is apparent that, on a graph of ln(V⁄V0) versus t, the slope would equal −τ. In this analysis, you will find the value of the constant V0, calculate ln(V⁄ V0) for every recorded value of V, create a graph of ln(V⁄ V0) versus Time, and find its slope. 1. Data Cursor Coordinates What was the voltage recorded at t = 0? Press the up arrow key to move the Data Cursor to the first recorded point.
134 C a p a c i t o r 3. Make a graph of ln(V⁄V0) versus t. a) Press display. b) Press Page. c) 4. D i s c h a r g e to return to the Home Screen; press F4 to open the Graphs menu; press 7?! F1 to open the Graph to select New Graph Press twice to highlight the data source menu. Select ln(v/v0) from the menu Apply a linear fit and find the value of τ. a) Press F3 to open the Tools menu; press 5jkl to select Linear Fit.
X p l o r e r G L X U s e r s ’ G u i d e 135 Act iv i ty 9 : Co nst ru c ti v e a nd D es t ru c t ive I nt er f ere n c e Background When two sound waves with identical frequencies and amplitudes combine, they may interfere constructively or destructively. When constructive interference occurs, the resulting tone is louder than either of the individual tones. When interference is destructive, the combined tone is less loud than the individual tones.
136 C o n s t r u c t i v e a n d D e s t r u c t i v e I n t e r f e r e n c e 8. Press F1 to turn on the Left Output Channel. How does the addition of the Left Output wave affect the sound that you hear? 9. Press + and to vary the phase of the Right Output wave again. As you vary the phase of the Right Output wave between -360° and +360°, how does the sound of the combined waves change? 10. Listen to the sound. At what values of phase does maximum destructive interference occur? 11.
X p l o r e r Ac t i v i ty 1 0: B ea t F r eq ue n c y Background When two sound waves with slightly different frequencies combine, the pattern of interference produced is known as beats. The rate at which the beats occur is the beat frequency. In this activity, the GLX will generate two tones whose frequencies differ by ∆ f, and you will hear the resulting beats. By varying the frequency of one of the tones, you will discover the relationship between ∆ f and beat frequency.
138 B e a t F r e q u e n c y Data Collection 1. Press F1 and F3 to turn on the Left and Right Output Channels. Describe what you hear. 2. In the chart on the next page, write the frequencies of the Left and Right Output Channels ( f left and f right ). You will use the GLX’s Stopwatch screen to time the beat period. Since it is not practical to measure the very short time between two beats, you will time 10 full beat cycles and later divide by 10 to calculate the period.
X p l o r e r 12. While viewing the Output Screen, press put channels. F1 and Left Channel Frequency Right Channel Frequency Frequency Difference f left f right ∆f F2 U s e r s ’ G u i d e to turn off both out- Elapsed Time for 10 Beat Cycles Analysis 1. For each line of the chart, calculate and record the frequency difference (∆ f = f left − f right ) and beat period, Tbeat. (You can do these calculations in your head.) 2.
140 B e a t F r e q u e n c y
X p l o r e r G L X U s e r s ’ G u i d e I nd ex A abs function 51 AC power 6 Analog Adapter 59 and() function 52 Annotation 25 Area Tool 20 Audio notes 25 Audio output 39, 50 Audio Settings 87 Audio temperature indicator, example 52 Automatic display launching 86 Automatic file opening 86 Automatic shut down 8, 85 Autoscale 16 Averaging 56 B Back light 6, 86 Backup GLX (to USB storage device) 83 Battery and file storage 94 capacity 95 charging 93 gauge 11 internal disconnection 94 reconditioning 95 re
142 I n d e x Multipress text input 90 N Name of GLX 85 New Page Graph 24 Notes 53 not() function 52 Note Editor dialog box 27 Notes (data annotation) 25 Notes screen 53 Numeric styles 70 O On/Off button 6 One-point offset calibration 73, 77 One-point slope calibration 72, 76 Opening a file 80 or() function 52 Oscilloscope emulation 22 Output Device (audio) 87 Output screen 39 Output-control calculations 50 outputfreq function 52 outputstate function 51 outputswitch function 51 outputvolume function 52 P
X p l o r e r G L X Sh o rt cut Su mm ary These keys and key combinations work from any screen in the GLX environment. Start and stop data collection Backlight + Contrast + Graph + F1 Table + F2 Calculator + F3 Sensors + F4 Home Screen Next Screen + Previous Screen + Use these shortcuts when working in the Graph Screen.
PASCO scientific XplorerGLX Font Software PRODUCT LICENCE AGREEMENT Read this license agreement carefully before signing it. You may use this PASCO Product only if you agree to the following terms and conditions. If you do not agree to the following terms and conditions, you must not use the PASCO Product. The following are the terms and conditions to which you agree upon when opening the package: 1.