
User Manual


EMpro - multi-functional energy measuring devices for front panel installation
128 / 192
PHOENIX CONTACT 108904_en_00
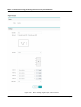
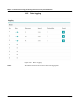
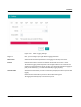
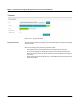
Figure 10-34 Menu: “Logging, Saved data”
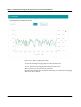
You can view all configured logging data as a chart in the web server.
To do so, select the desired logging data from the drop-down menu.
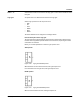
With your mouse, you can zoom in on the saved data.
By means of the selection box to the right next to the chart, you can also export the logging
data as CSV, XLS or PDF file.