
User manual


PicoScope 6 User's Guide 109
Copyright © 2007-2013 Pico Technology Ltd. All rights reserved. psw.en r32
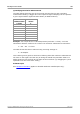
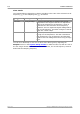
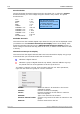
Quantifying Resolution Enhancement
The table below shows the size of the moving-average filter for each resolution
enhancement setting. A bigger filter size requires a higher sampling rate to represent
a given signal without significant side-effects (as detailed above).
Resolution
enhancement
e (bits)
Number of
values
n
0.5
2
1.0
4
1.5
8
2.0
16
2.5
32
3.0
64
3.5
128
4.0
256
Example. Your scope device is a PicoScope 5204 (resolution = 8 bits). You have
selected an effective resolution of 9.5 bits. The resolution enhancement is therefore:
e=9.5 – 8.0 = 1.5 bits.
The table shows that this is achieved using a moving average of:
n = 8 samples.
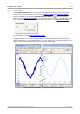
This number gives a guide to what sort of filtering effect the resolution enhancement
will have on the signal. The best way of seeing the actual low-pass filter effect is to
add a spectrum view and look at the shape of the noise floor (try dragging the y-axis
upwards to see the noise more clearly).
Related topics
See Hardware resolution (applies to Flexible Resolution Oscilloscopes only).