
User manual


PicoScope and oscilloscope primer18
Copyright © 2007-2013 Pico Technology Ltd. All rights reserved.psw.en r32
5.10
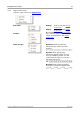
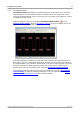
Spectrum view
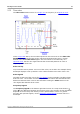
A spectrum view is one view of the data from a scope device. A spectrum is a
diagram of signal level on a vertical axis plotted against frequency on the horizontal
axis. PicoScope opens with a scope view, but you can add a spectrum view by using
the views menu. Similar to the screen of a conventional spectrum analyzer, a
spectrum view shows you one or more spectra with a common frequency axis. Each
view can have as many spectra as the scope device has channels. Click on one of the
labels below to learn more about a feature.
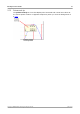
Unlike in the scope view, in the spectrum view the data is not clipped at the limits of
the range displayed on the vertical axis, so you can apply axis scaling or offset to see
more data. Vertical axis labels are not provided for data outside what is considered to
be the 'useful' range, but rulers will still work outside this range.
Spectrum views are available regardless of which mode - Scope Mode or Spectrum
Mode - is active.
For more information, see: How to set up the spectrum view and Spectrum Options
dialog.