
User manual


PicoScope and oscilloscope primer20
Copyright © 2007-2013 Pico Technology Ltd. All rights reserved.psw.en r32
5.12
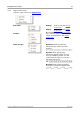
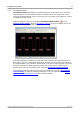
Measurements table
A measurements table displays the results of automatic measurements. Each view
can have its own table, and you can add, delete or edit measurements from this table.
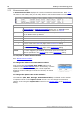
Measurements table columns
Name
The name of the measurement that you selected in the Add
Measurement or Edit Measurement dialog. An "F" after the name
indicates that the statistics for this measurement are filtered.
Span
The section of the waveform or spectrum that you want to measure.
This is 'Whole trace' by default.
Value
The live value of the measurement, from the latest capture
Min
The minimum value of the measurement since measuring began
Max
The maximum value of the measurement since measuring began
Average
The arithmetic mean of the measurements from the last n captures,
where n is set in the General page of the Preferences dialog
σ
The standard deviation of the measurements from the last n captures,
where n is set in the General page of the Preferences dialog
Capture
Count
The number of captures used to create the statistics above. This starts
at 0 when triggering is enabled, and counts up to the number of
captures specified in the General page of the Preferences dialog.
To add, edit or delete measurements
See: Measurements toolbar.
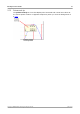
To change the width of a measurement column
First ensure that the Column Auto-width option is not
enabled in the Measurements menu. If necessary, click the
option to switch it off. Then drag the vertical separator
between column headings to resize the columns, as shown
opposite.
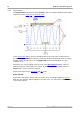
To change the update rate of the statistics
The statistics (Min, Max, Average, Standard Deviation) are based on the number
of captures shown in the Capture Count column. You can change the maximum
capture count using the Capture Size control in the General page of the Preferences
dialog.