
Datasheet


Mask limit testing
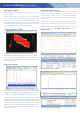
PicoScope allows you to draw a mask around any signal with user-
defined tolerances. This has been designed specifically for production
and debugging environments, enabling you to compare signals. Simply
capture a known good signal, draw a mask around it, and then attach
the system under test. PicoScope will capture any intermittent glitches
and can show a failure count and other statistics in the Measurements
window.
The numerical and graphical mask editors can be used separately or
in combination, allowing you to enter accurate mask specifications,
modify existing masks, and import and export masks as files.
Custom probe settings
The custom probes menu
allows you to correct for
gain, attenuation, offsets and
nonlinearities of probes and
transducers, or convert your
waveform data to different
units such as current, scaled
voltage, temperature,
pressure, power or dB.
Definitions can be saved to
disk for later use. Definitions for standard Pico-supplied oscilloscope
probes and current clamps are built in, but you can also create your
own using linear scaling or even an interpolated data table.
High-end features as standard
Buying a PicoScope is not like making a purchase from other oscilloscope
companies, where optional extras considerably increase the price.
With our scopes, high-end features such as resolution enhancement,
mask limit testing, serial decoding, advanced triggering, automatic
measurements, math channels, XY mode, segmented memory (where
available), and a signal generator are all included in the price.
To protect your investment, both the PC software and firmware
inside the scope can be updated. Pico Technology have a long history
of providing new features for free through software downloads. We
deliver on our promises of future enhancements year after year, unlike
many other companies in the field. Users of our products reward us
by becoming lifelong customers and frequently recommending us to
their colleagues.
Math channels
With PicoScope 6 you
can perform a variety of
mathematical calculations
on your input signals and
reference waveforms.
Use the built-in list for
simple functions such as
addition and inversion,
or open the equation
editor and create complex
functions involving trigonometry, exponentials, logarithms, statistics,
integrals and derivatives.
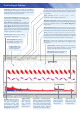
Serial decoding
The PicoScope 2200A Series oscilloscopes include serial decoding
capability as standard. The decoded data can be displayed in the
format of your choice: In view, In window, or both at once.
•In view format shows the decoded data beneath the waveform on
a common time axis, with error frames marked in red. These frames
can be zoomed to investigate noise or distortion.
•In window format shows a list of the decoded
frames, including the data and all flags and identifiers.
You can set up filtering conditions to display only
the frames you are interested in, search for frames
with specified properties, or define a start pattern
to signal when the program should list the data.
It is also possible to create a spreadsheet to decode the hexadecimal
data into user-defined text strings.
High-speed data acquisition and digitizing
The supplied drivers and software development kit allow you to both
write your own software and interface to popular third-party software
packages such as LabVIEW and MATLAB.
The drivers support data streaming, a mode that captures gap-free
continuous data over the USB port directly to the PC’s RAM or hard
disk at a rate of 1 to 9.6 MS/s, so you are not limited by the size of the
scope’s buffer memory. Sampling rates in streaming mode are subject
to PC specifications and application loading.
PicoScope 2000 Series Oscilloscopes
PicoScope 2200A Series Oscilloscopes
Serial protocols
UART/RS-232
SPI
I
2
C
I
2
S
CAN
LIN