
User manual
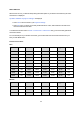
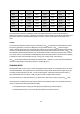
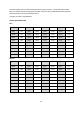
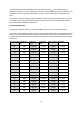
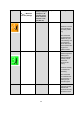
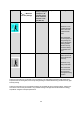
Table Of Contents
- Contents
- Introduction
- Get started
- Settings
- Training
- After Training
- Features
- Polar Flow App
- Polar Flow Web Service
- Syncing
- Caring for Your M400
- Important Information
- Bookmarks

47
The classification is based on a literature review of 62 studies where VO
2max
was measured directly in
healthy adult subjects in the USA, Canada and 7 European countries. Reference: Shvartz E, Reibold RC. Aer-
obic fitness norms for males and females aged 6 to 75 years: a review. Aviat Space Environ Med; 61:3-11,
1990.
There may be some daily variation in the Running Indexes. Many factors influence Running Index. The value
you receive on a given day is affected by changes in running circumstances, for example different surface,
wind or temperature, in addition to other factors.
LONG-TERM ANALYSIS
The single Running Index values form a trend that predicts your success in running certain distances.
The following chart estimates the duration that a runner can achieve in certain distances when performing max-
imally. Use your long-term Running Index average in the interpretation of the chart. The prediction is best for
those Running Index values that have been received at speed and running circumstances similar to the target
performance.
Running Index Cooper test
(m)
5 km (h:m-
m:ss)
10 km (h:m-
m:ss)
Half marathon Marathon
36 1800 0:36:20 1:15:10 2:48:00 5:43:00
38 1900 0:34:20 1:10:50 2:38:00 5:24:00
40 2000 0:32:20 1:07:00 2:29:30 5:06:00
42 2100 0:30:40 1:03:30 2:21:30 4:51:00
44 2200 0:29:10 1:00:20 2:14:30 4:37:00
46 2300 0:27:50 0:57:30 2:08:00 4:24:00
48 2400 0:26:30 0:55:00 2:02:00 4:12:00
50 2500 0:25:20 0:52:40 1:57:00 4:02:00
52 2600 0:24:20 0:50:30 1:52:00 3:52:00
54 2700 0:23:20 0:48:30 1:47:30 3:43:00
56 2800 0:22:30 0:46:40 1:43:30 3:35:00
58 2900 0:21:40 0:45:00 1:39:30 3:27:00
60 3000 0:20:50 0:43:20 1:36:00 3:20:00
62 3100 0:20:10 0:41:50 1:32:30 3:13:00
64 3200 0:19:30 0:40:30 1:29:30 3:07:00
66 3300 0:18:50 0:39:10 1:26:30 3:01:00