
Instruction Manual


45
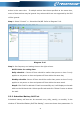
Diagram 5-20
NOTE: This screen may be different for different types of UPSs.
Step 2 Select monitoring parameters on left-hand tab to switch diagram.
Input voltage monitoring shows any change for input voltage.
Output voltage monitoring shows any change for output voltage.
Input frequency monitoring shows any change for input frequency
Output frequency monitoring shows any change for output frequency.
Load level monitoring shows any change for connected load level
Battery capacity monitoring shows any change for connected battery capacity.
UPS temp. Monitoring shows any temperature change for monitored UPS.
Step 3
Time interval setting, It displays real-time data changes in certain interval. To
change time interval in X-axis of diagram, simply click up-down arrows and
then click “Refresh” icon to get the updated diagram with new setting interval.
Refer to Diagram 5-20
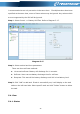
5.4.2. History
5.4.2.1.
Event Log
In the Event Log window, it’s shown all history events. Users can analyze the history