
User`s guide


E-Prime User’s Guide
Chapter 3: Critical Timing
Page 117
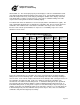
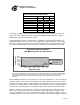
Limits on Stimulus Presentation Rates
CPU Speed
450MHz 266MHz 120MHz
Refresh Rate
60.1Hz 70.1Hz 70.4Hz
Target Duration (ms)
Observed Duration (ms)
100 100 96 94
83 83 82 80
67 66 55 80
33 33 55 80
17 33 55 80
Note that the 450MHz computer followed the target duration down to 33ms, but could not go
below 33ms for the stimuli used in this example. The 266MHz followed until 55ms, and the
120MHz was only able to follow down to 80ms.
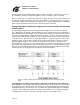
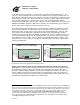
Timing Paradigm 5 presents a stimulus that is a rotating checkerboard. This paradigm very
efficiently illustrates visible pauses due to the reading time required by images. If the reading
time is less than the presentation time, the experiment will appear to present images at faster
rates with reducing durations. Figure 23 plots the display time as the Duration is decreased.
High Rate Image Presentation
(450 MHz Processor, 60.1 Hz Refresh)
0.00
16.67
33.33
50.00
66.67
83.33
100.00
116.67
1 121 241 361 481 601 721
Sequential Image
Delay Between
Stimuli (ms)
Measured Duration
Intended Duration
Onset Delay
Figure 23. Recorded display times and onset delays at shorter display durations. The Intended Duration (white
line) shows the target duration. The Measured Duration (grey line) shows the display time that occurred. The
Onset Delay (black line) shows the delay from the end of the previous display until the next image was
presented.
On the 450MHz computer, the presentation rates reduced from 100 to 83, 67, 50, and 33ms but
could not operate at 17ms (Note, for images 601-721 the intended duration was 17ms and the
observed was at 33ms with some spikes at 50ms). The black line shows onset delay logged by
E-Prime for each image display. With durations longer than 33ms, the onset delay was always
close to 10ms, expected with the event duration being set 10ms below the intended duration.
When the duration is set to 33ms, the onset delays are generally at 10ms, with some delays of
27ms. This is because with only 33ms to read in the image and prepare it for display, small
losses of computer time (e.g., due to the program doing disk output for data logging, speed of
reading the disk due to state of the disk cache, or operating system delays) delay the experiment