
User`s guide


E-Prime User’s Guide
Chapter 3: Critical Timing
Page 121
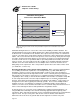
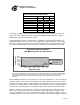
below 5-6ms (from images 1081 on). A brief look at the plot allows the user to detect a single
mismatch in timing over any of the 2160 images presented in this test program.
Image Duration and Onset Delay
0
20
40
60
80
100
120
1 201 401 601 801 1001 1201 1401 1601 1801 2001
Sequential Image
Display Duration (ms)
Duration
Onset Delay
Refresh Duration
Figure 26. Plot created using Excel to calculate errors in stimulus onset time (exported from E-DataAid).
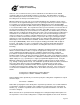
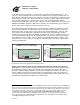
The next figure (Figure 27) illustrates the timing events for a run session with three errors. First,
the figure indicates that there were missed refresh detection events. The figure shows the
intended duration, measured duration, and onset delay. Look first at the onset delay. Any onset
beyond a single refresh (14ms in this case) indicates an error. There are spikes in the onset
delay at images 67 and 173. These spikes are 1 or 2 refresh durations longer than expected,
indicating a single or double miss of the refresh signal. Thus, a refresh was not detected, and the
display was longer
17
than intended.
High Rate Image Presentation
(266 MHz Processor, 73.1 Hz Refresh)
0.00
16.67
33.33
50.00
66.67
83.33
100.00
116.67
1 121 241 361 481 601 721
Sequential Image
Delay Between
Stimuli (ms)
Measured Duration
Intended Duration
Onset Delay
Figure 27. Plot of onset delays showing problems in display timing.
17
Note again that this data was obtained with E-Prime’s Vertical Blank Simulation feature disabled in order
to illustrate what effect a missed refresh has on the timing data. With this feature enabled, these errors
would have been automatically corrected in most cases.