
User`s guide


E-Prime User’s Guide
Chapter 5: Data Handling
Page 202
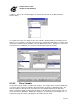
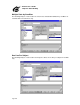
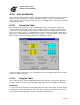
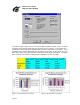
Select the plot type (column or line) as well as the plot orientation (column or row). A column
orientation means that the application plots the data series by columns. In other words, the
column labels make up the plot’s legend and the row labels make up the x-axis labels. A row
orientation means that the application plots the data series by rows. In other words, the row
labels make up the plot’s legend and the column labels make up the x-axis labels. The figures
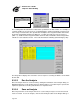
below compare and contrast four different plot combinations for the same table.
Figure 1. Column plot with column orientation.
Figure 2. Column plot with row orientation.