
Instruction Manual

21
Addendum for
StudioLive Mixers
OverviewStudioLive
Remote
QMixTroubleshooting
Universal Control 1.6 with VSL 2
Universal
Control and
VSL
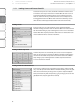
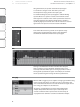
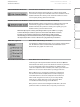
Enabling a GEQ
By default, all graphic EQs are disabled. To enable them remotely via VSL,
simply click on the Enable button to the left of the sliders.
Flattening a GEQ Curve
To zero out all curve settings on any GEQ, click on the Flatten GEQ button,
which is directly below the Enable button. This will flatten all band gains
to 0 dB so that they neither boost nor attenuate any of the 31 bands.
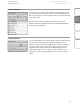
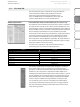
Enabling Smaart Analysis
By default, Smaart analysis is disabled. While Smaart is
disabled, you have control over which bus is routed to
Auxiliary Inputs 29 and 30 (StudioLive 16.4.2 and 24.4.2).
Clicking on the Spectrograph or RTA buttons will start Smaart, and VSL will
take control over Auxiliary Inputs 29 and 30 (StudioLive 16.4.2 and 24.4.2).
16.0.2 Users: You must route your Main Mix to Flexible Inputs 15 and 16 in
order to use Smaart analysis. If analog inputs 15 and 16 are patched to the
Flexible Inputs, the Spectrograph and RTA buttons will not function.
For more information on the Auxiliary Inputs or Flexible
Inputs Router, please see Section 2.5.6.
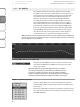
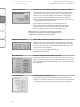
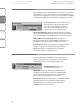
Time-Frequency Spectrograph
Clicking on the Spectrograph button will launch the Time-Frequency
Spectrograph. This Spectrograph provides a three-dimensional view of
your audio in which x= frequency, y=time, and color=decibel level.
Any signal below the lower dynamic-range threshold is black.
Any signal above the top dynamic-range threshold is white.
Within the dynamic range, colors go from blue to green to red,
with blue indicating the quietest and red the loudest.
Many audio signals that are encountered in the field are highly
dynamic. Musical signals, speech, and even environmental noise
contain significant changes in spectral content as a function of
time. The Spectrograph can be thought of as a record of multiple
RTA spectra taken over time, with color representing amplitude.
VSL: Virtual StudioLive 2.5