
Computer Hardware User Manual

Chapter 4: Management with WebPAM PROe
47
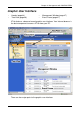
Management Window
The Management Window provides the actual user interface with the VTrak. This
window changes depending on which item you select in Tree View and which tab
you select in the Management Window itself.
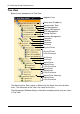
Event Frame
To display the Event Frame, click on View in the Header, then click on Show
Event Frame. Events are listed and sorted by:
• Number – A consecutive decimal number assigned to a specific event
• Device – Battery, controller, logical drive, physical drive, port, etc.
• Event ID – The hexadecimal number that identifies the specific type of event
• Severity – Information, Warning, Minor, Major, Critical, and Fatal. The
severity level is user-specified. See “User Event Subscription” on page 56.
• Time – Time and date of the occurrence
• Description – A brief description of the event
Click on the Subsystems icon and Events tab for event settings.
Subsystems
The Subsystems–Information tab lists all related subsystems. There are no user
settings on this tab. To access the Subsystems–Information tab, click on the
Subsystems icon in Tree View.
Each individual subsystem is identified in the Tree by its Management Port IP
address.
To see all of the VTrak subsystems on your network:
1. Move your cursor over Storage Network in the Header.
A “Show Network Subsystems” message will appear.
2. Click on the “Show Network Subsystems” message to display the
subsystems.
The list will show all subsystems on the network at the time the GUI was
launched.
3. To update the list, click the Discover button at the bottom of the list.
To log into any of the displayed VTrak subsystems:
1. In Tree View, click on the Subsystem icon of the subsystem you want to see.
If your user name and password do not match the subsystem you are
logging into, the log in screen will appear.
2. Log in to the new subsystem, as needed.