
Installation guide

Wireless Guide 113
Advanced Features for Wireless Analysis
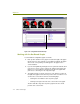
You can widen or narrow the time scale of the graph by clicking the
Long term (widen) or Short term (narrow) buttons at the top of the
graph.
You can reset the statistics in the Dashboard (including the graphs) by
clicking Reset at the top of the Dashboard.
Setting Thresholds for the Dashboard Statistics
You can set alarm thresholds for each of the dials on the Dashboard (as well
as many other network statistics). When a threshold is exceeded, an entry is
made in the Alarm log. You can monitor the Alarm log to keep watch over your
network.
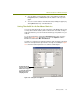
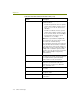
To set a threshold value, click the Set Thresholds button at the top of the
Dashboard (Figure 10-4). Alternatively, you can select Options from the
Tools menu and click the Mac Threshold tab.
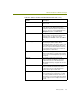
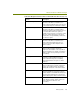
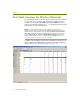
You will see a complete list of network parameters that can trigger a threshold
alarm. The exact parameters depend on the currently selected adapter. Figure
10-5 shows the network parameters for a Wireless LAN adapter.
Figure 10-5. Setting Threshold Options
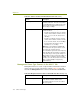
The High Threshold
value for each measure
will be the average per
second value measured
during the monitor
sampling interval