
System information


Network Vital Signs Mode
95
• Create Filter on station address(es)—activates the Filters dialog.
• Create Filter on pair address(es)—activates the Filters dialog.
• Find—displays the Find dialog.
• Display Properties—displays the Display Properties dialog.
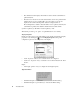
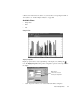
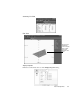
3D Chart and Pie Views
Observer also offers 3D bar chart and pie views of Network Errors by Station. Simply
click the 3D bar or Pie icon on the left side of the window. You can change colors and
other display properties by right-clicking the chart and selecting Display Properties
from the pop-up menu.
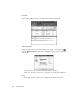
Network Vital Signs Mode
The Network Vital Signs mode shows the current network activity mapped with current
error conditions on your network.
This section describes the Vital Signs as displayed for standard Ethernet analysis. For
FDDI Vital signs, see “FDDI Network Vital Signs” on page 162. For Wireless Vital
signs, see “Wireless Vital Signs” on page 163.
Menu Path
Statistics->Network Vital Signs
Purpose
The Network Vital Signs display gives you a complete snapshot of error conditions and
of their importance in the context of current network activity. Aggregate problems
found here can be pinned down to a specific station using the “Errors by Station mode.”
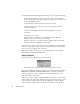
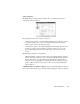
The Ethernet Network Vital Signs will ONLY show errors that are available
with your specific NDIS driver. To see what errors your driver supports,
select Options > Selected Probe or SNMP Device Properties >
Probe Parameters
tab. The area under “Network errors that NIC NDIS
drivers claims to provide” will show which NDIS errors your network card
is capable of counting.
The importance of the error condition is key when trying to determine the severity of a
particular error. For example, 50% CRC packet errors is not a problem if the sample
size (total activity) is two packets. On the other hand, 10% CRC packet errors during a
busy traffic period represents a critical problem.
Observer’s Network Vital Signs informs you at a glance as to the error condition and its
severity with respect to traffic conditions by combining graphical shapes with specific
color codes.