
System information


20
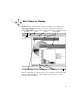
Main Observer Display
• Triggers and Alarms—displays the Triggers and Alarms mode. See “Triggers and
Alarms Mode” on page 148.
Trending/Analysis Menu
• Network Trending—displays the Network Trending mode.
• Start Network Trending Viewer—starts the Network Trending viewing console.
• Start Web Browser Report—displays the Web Publishing Service window.
• Application Analysis—displays the Application Analysis Mode, which shows
how various types of servers are performing.
• Load and Analyze Observer Capture Buffer—allows you to load a previously
saved packet buffer for analysis by the Decode and Analysis submode of Packet
Capture mode.
• WAN Delay Analysis—displays the WAN Delay Analysis Mode.
Tools Menu
• Discover Network Names—displays the Discover Network Names mode. This is
where you can automatically discover your hard network addresses and alias the
hard addresses to names.