
System information

Collecting SNMP Agent Information
345
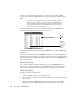
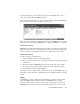
the chart in the current agent information window if one is open, or will open a new agent
information window if one is not currently running.
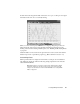
When you select a chart request, SNMP Extension begins polling the agent. You can
define the length of the request period and define chart display parameters by right-
clicking on the chart and selecting Chart Properties. See “Building and Modifying Charts”
on page 359.
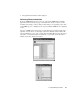
Chart information can be saved from the agent window. You can save the chart data in a
file then import it into a spreadsheet program (e.g., Microsoft Excel or Lotus 1-2-3).
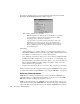
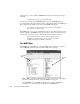
Customizing Charts
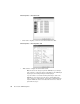
When agent information is displayed in chart format, several options are available for
customizing the display. To define the following settings, right-click on the chart and
select C
HART PROPERTIES.
Note: When changes are made to a chart from the Chart Properties display
window, the changes are effective for the present session only. Persistent
changes must be made to the chart from the MIB Editor. See “Using the MIB
Editor” on page 354.