
System information
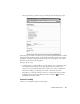

Using Web Publishing Service
403
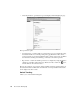
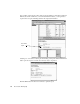
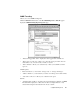
• “Network IP group protocol distribution” checkbox—if selected, the report will
capture network IP group protocol distribution. You can select the data to be
displayed as a chart and/or a table.
• “Network IP applications distribution” checkbox—if selected, the report will capture
network IP applications distribution. You can select the data to be displayed as a chart
and/or a table.
• “Network IPX subprotocol distribution” checkbox—if selected, the report will
capture network IPX subprotocol distribution. You can select the data to be displayed
as a chart and/or a table.
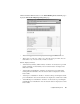
• “Network errors distribution” checkbox—if selected, the report will capture network
errors distribution. You can select the data to be displayed as a chart and/or a table.
• “Network top talkers” checkbox—if selected, the report will capture top talkers. You
can select the data to be displayed as a chart and/or a table. You may also select to
show all stations on the network or you may limit the number to a user-specified
number of top talkers.
• “Station errors distribution” checkbox—if selected, the report will capture station
errors distribution. You can select the data to be displayed as a chart and/or a table.
You may also select to show all stations on the network or you may limit the number
to a user-specified number of error procedures.
• “Router statistics” checkbox—if selected, the report will capture router statistics. You
can select the data to be displayed as a chart and/or a table.
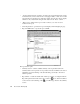
• “Transparent chart/pie background” checkbox—if selected, the report chart (if
defined) will have a transparent background.
• “Enter a note to include in the report” textbox—allows you to enter a note for
inclusion in the report.